

Question: Food retailing business data chart contains both the sample data (January 2010 December 2019)- Series 1 and the forecasts (January 2020 December 2020) Series 2
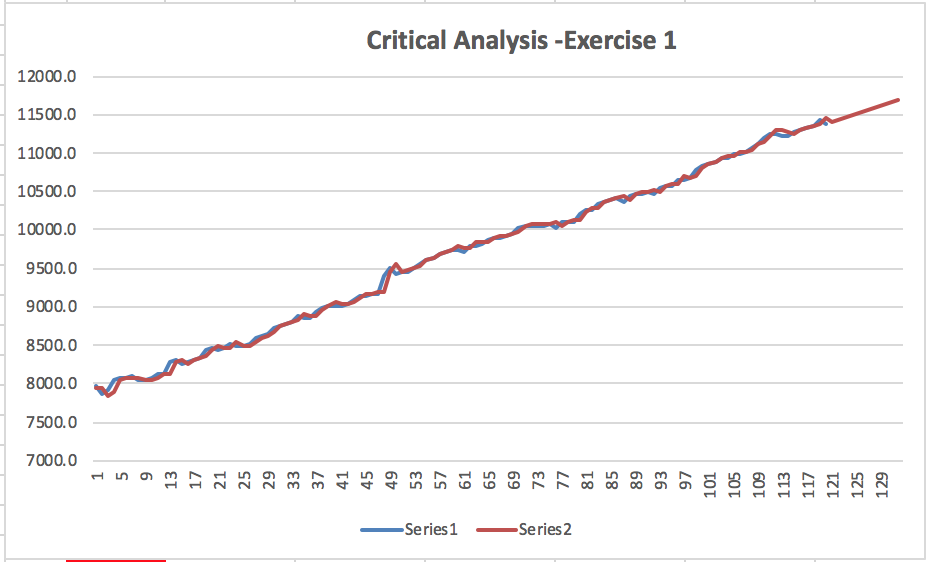
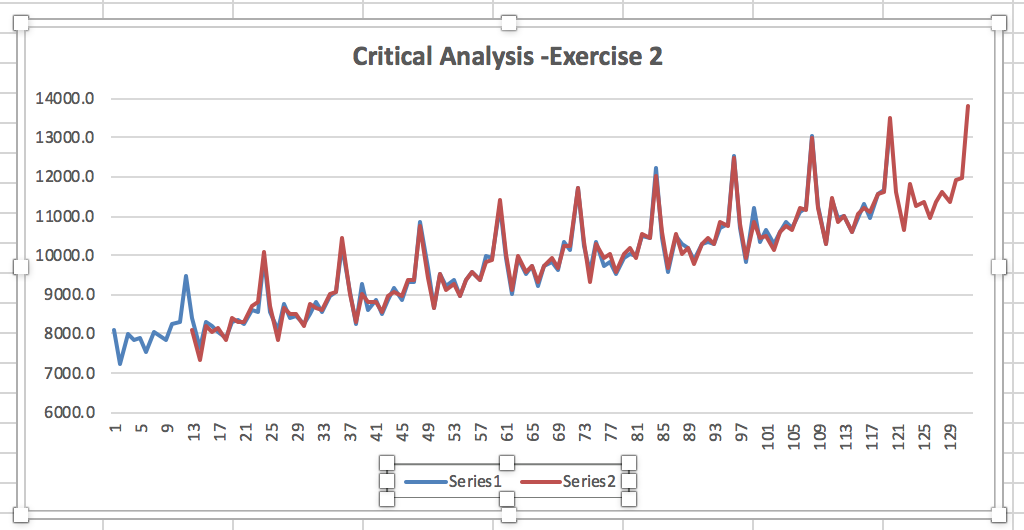
Food retailing business data
chart contains both the sample data (January 2010 December 2019)- Series 1 and the forecasts (January 2020 December 2020) Series 2
Questioned to be answered in context to Business forecasting
-
Compare and contrast the two models and critically analyse your results and put forward a
recommendation for your choice of model.
-
In light of recent events, critically evaluate your choice of model, and critically evaluate the factors
you would need to consider when forecasting in light of recent events.
-
In the context of business forecasting, critically think and discuss any other considerations that need to be taken into account for your forecasts / forecasting to be useful for business purposes.
7000.0 7500.0 8000.0 8500.0 9000.0 9500.0 10000.0 10500.0 11000.0 11500.0 12000.0 29 33 37 41 45 49 53 -Series 1 57 61 65 69 -Series 2 Critical Analysis - Exercise 1 73 77 81 85 68 93 97 101 105 109 113 117 121 125 129 Critical Analysis -Exercise 2 14000.0 13000.0 12000.0 11000.0 10000.0 9000.0 when her heart beantworten har en tenden 8000.0 7000.0 6000.0 21 29 33 41 OORN 81 85 89 93 97 101 105 109 113 117 121 125 129 -Series 1 Series 2 000 7000.0 7500.0 8000.0 8500.0 9000.0 9500.0 10000.0 10500.0 11000.0 11500.0 12000.0 29 33 37 41 45 49 53 -Series 1 57 61 65 69 -Series 2 Critical Analysis - Exercise 1 73 77 81 85 68 93 97 101 105 109 113 117 121 125 129 Critical Analysis -Exercise 2 14000.0 13000.0 12000.0 11000.0 10000.0 9000.0 when her heart beantworten har en tenden 8000.0 7000.0 6000.0 21 29 33 41 OORN 81 85 89 93 97 101 105 109 113 117 121 125 129 -Series 1 Series 2 000
Step by Step Solution
There are 3 Steps involved in it

Get step-by-step solutions from verified subject matter experts