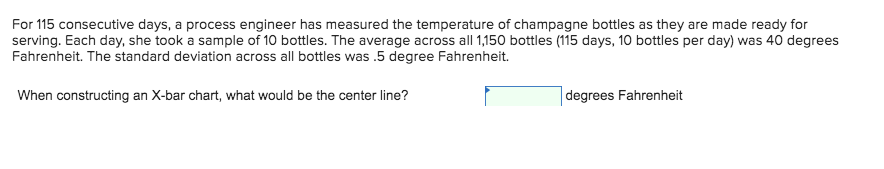
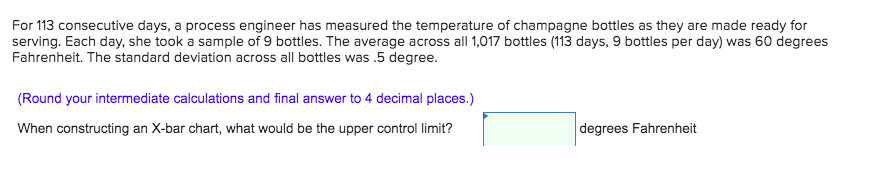
Question: For 115 consecutive days, a process engineer has measured the temperature of champagne bottles as they are made ready for serving. Each day, she took

For 115 consecutive days, a process engineer hasFor 115 consecutive days, a process engineer has

For 115 consecutive days, a process engineer has measured the temperature of champagne bottles as they are made ready for serving. Each day, she took a sample of 10 bottles. The average across all 1,150 bottles (115 days, 10 bottles per day) was 40 degrees Fahrenheit. The standard deviation across all bottles was .5 degree Fahrenheit. When constructing an X-bar chart, what would be the center line? degrees Fahrenheit For 113 consecutive days, a process engineer has measured the temperature of champagne bottles as they are made ready for serving. Each day, she took a sample of 9 bottles. The average across all 1,017 bottles (113 days, 9 bottles per day) was 60 degrees Fahrenheit. The standard deviation across all bottles was .5 degree. (Round your intermediate calculations and final answer to 4 decimal places.) When constructing an X-bar chart, what would be the upper control limit? degrees Fahrenheit

Step by Step Solution

There are 3 Steps involved in it

1 Expert Approved Answer
Step: 1 Unlock blur-text-image
Question Has Been Solved by an Expert!

Get step-by-step solutions from verified subject matter experts

Step: 2 Unlock
Step: 3 Unlock

Students Have Also Explored These Related General Management Questions!