

Question: For a given data set, I successfully computed the three different kinds of local smoothing estimates at every point in the data set: loess (with
For a given data set, I successfully computed the three different kinds of local smoothing estimates at every point in the data set: loess (with span = 0.75) colored in black, Nadaraya-Watson (NW) kernel smoothing with Gaussian Kernel, and bandwidth = 0.2 which is colored in red, and spline smoothing with the default tuning parameter colored in blue. The first chart is for Empirical Plot for Equi-distant for Bias and the other is for variance. I am told to report a though analysis of the visualizations above, but nothing special comes to my mind. Can you report the findings from the charts based on the two measures? Additionally, is it a fair comparison among the three methods? I think it is since the evaluation is based on the same metrics. Can you suggest any other thoughts on it?
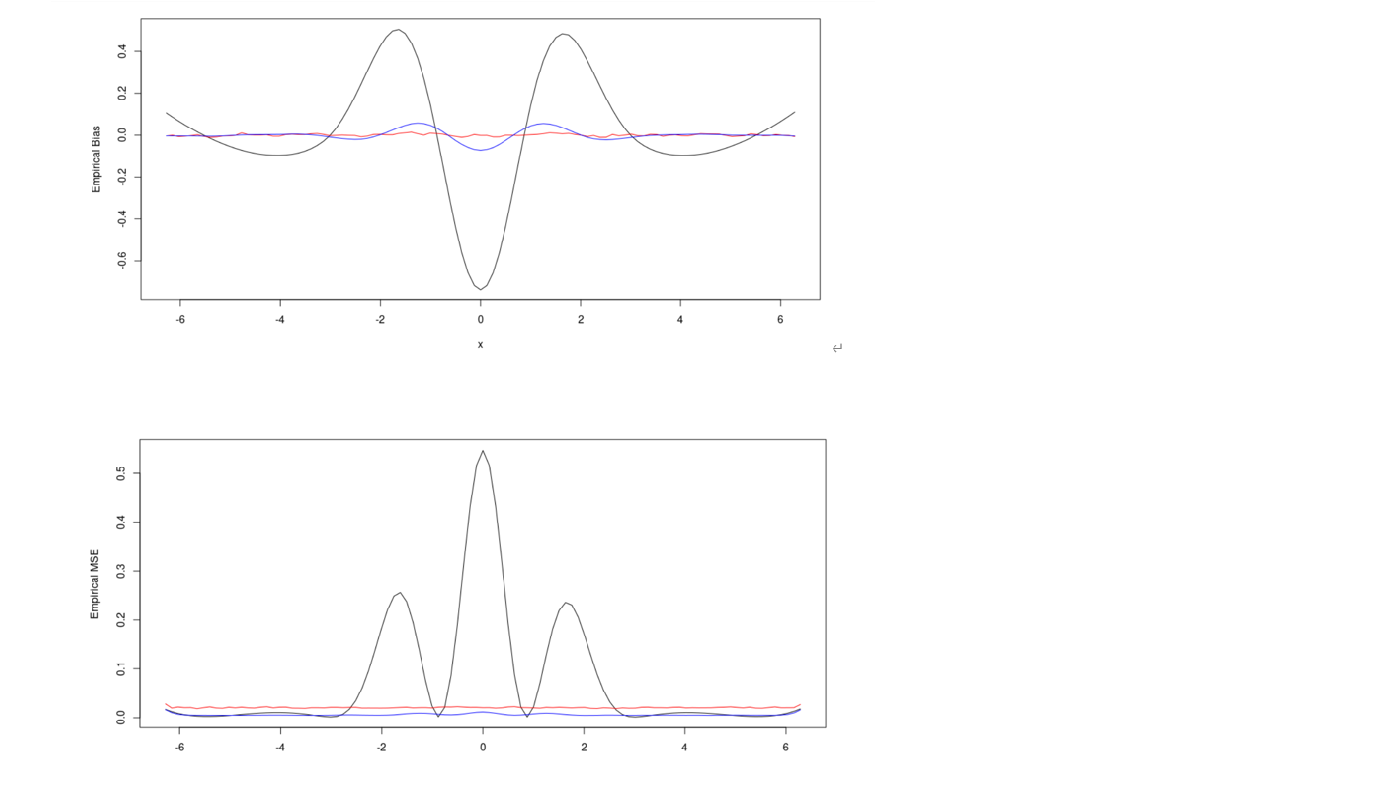
Empirical MSE Empirical Bias 0.0 0.2 0.3 0,4 0.5 -0.6 -0.4 -0.2 0.0 0.2 0.4 6 6 -2 -2 x 2 6
Step by Step Solution
There are 3 Steps involved in it

Get step-by-step solutions from verified subject matter experts