

Question: For a given data set, you will create a Shewart Control Chart, and a CUSUM Control Chart. You will then discuss the pros and cons
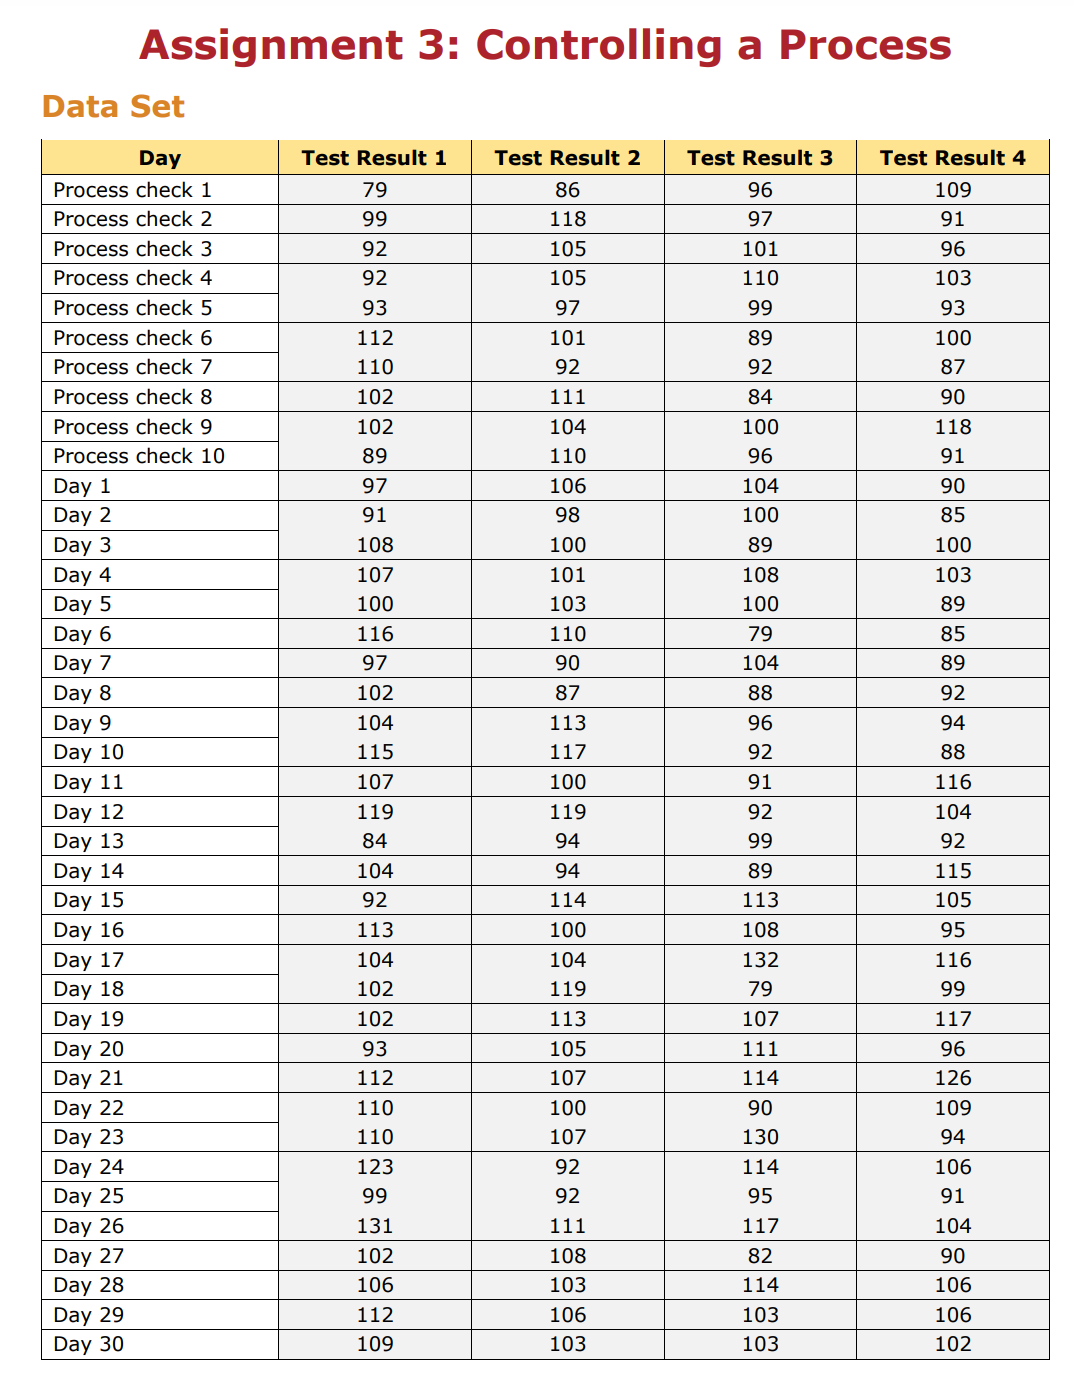
For a given data set, you will create a Shewart Control Chart, and a CUSUM Control Chart. You will then discuss the pros and cons of each type of chart, choose the best chart type for this data, and record/defend your answers. You will also be responsible for determining whether the given data signals an out of control process and on what day. If your customer's specifications require a product with an average result of 100 +/- 25, calculate the process capability of this process. Use the process check results to calculate your control chart limits and process capability.
Instructions:
- review the data and (using a fair distribution of work) create a Shewhart Control Chart, a CUSUM Control Chart, and a GESUM Control Chart based on it. Your charts should be created in such a format that they can be imported into a Microsoft Word document (i.e. an image, Microsoft Excel chart).
- After creating these charts, discuss the pros and cons of each and choose the best one for this type of data. Record your lists of pros and cons and a defense for why your chosen chart is the best on on the same Microsoft Word document.
- Next, determine whether the given data signals an out of control process and calculate the process capability (given the customer specification in the above overview. Record, using references to course readings where necessary, your determination and calculation on the same Microsoft Word document.
Assignment 3: Controlling a Process Data Set
Step by Step Solution
There are 3 Steps involved in it
1 Expert Approved Answer
Step: 1 Unlock

Question Has Been Solved by an Expert!
Get step-by-step solutions from verified subject matter experts
Step: 2 Unlock
Step: 3 Unlock