

Question: For all plots for this question, it is not necessary to include axis labels. Include a legend where the values plotted are non-binary. Always include
For all plots for this question, it is not necessary to include axis labels. Include a legend where the values plotted are non-binary. Always include a title. Additionally, for all heatmap" style plots for this question, use darker colors to indicate higher densities or node connections, and lighter colors to indicate sparsity or nodes not being connected.
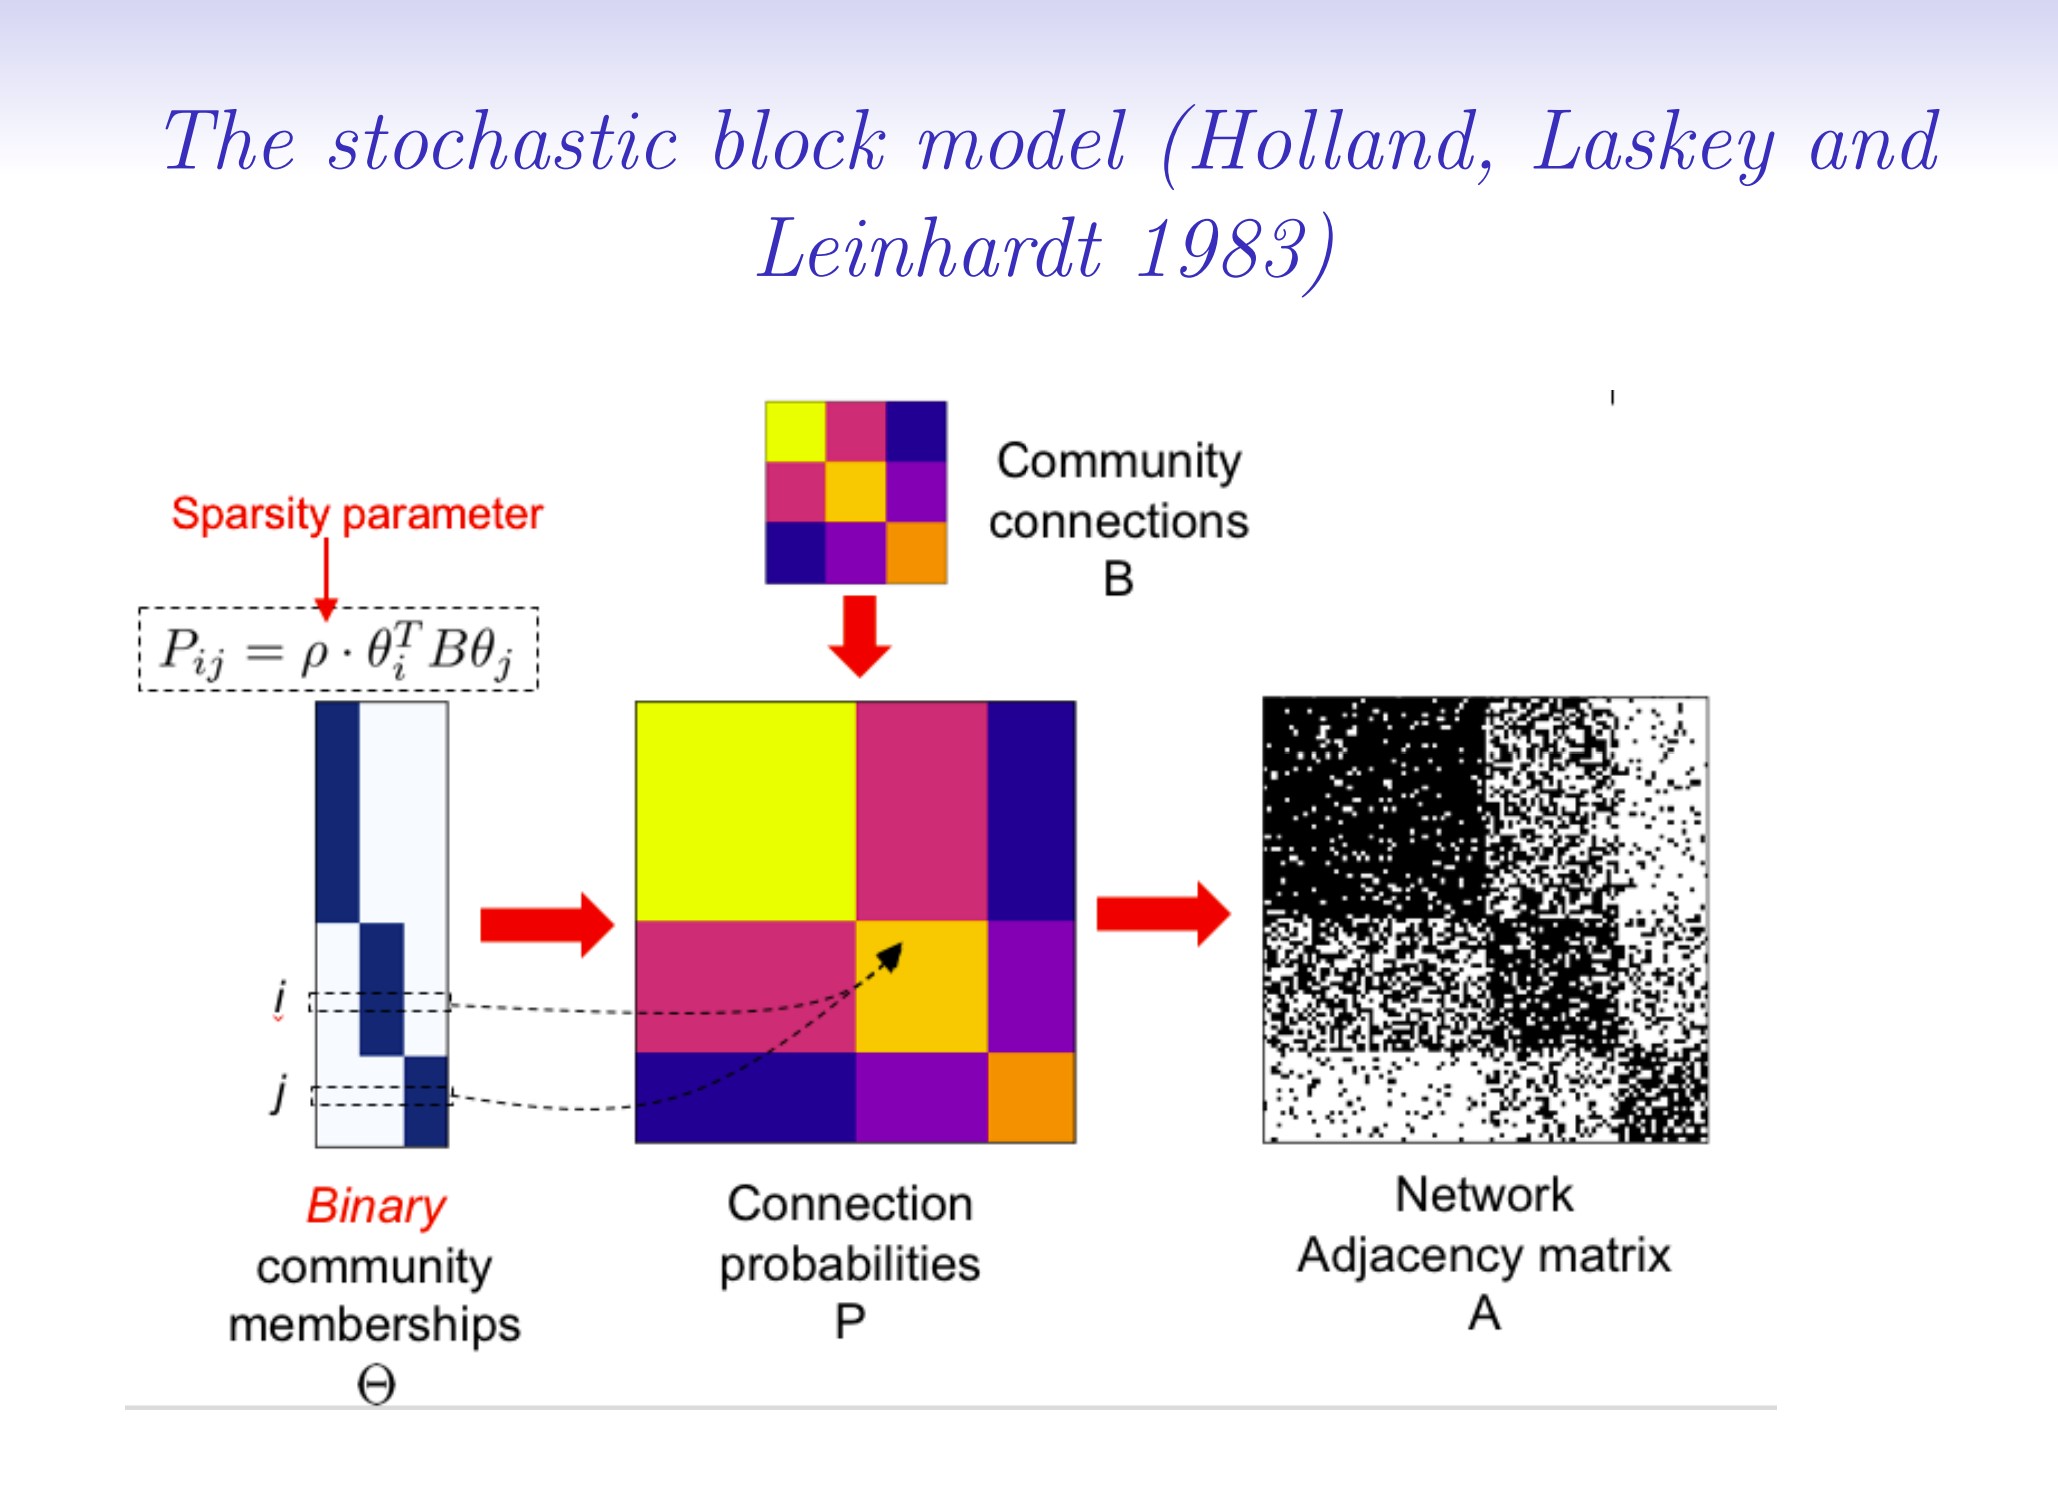
Consider the following Stochastic Block Model (SBM) specified by the following parameters: 7r:(.5 .15 .35) .9 .15 .25 B : .15 .75 .05 .25 .05 .6 p : 1 For all plots for this question, it is not necessary to include axis labels. Include a legend where the values plotted are nonbinary, Always include a title. Additionally, for all heatmap" style plots for this question, use darker colors to indicate higher densities or node connections, and lighter colors to indicate sparsity or nodes not being connected. a. For n : 200, generate an instance of the binary community membership 8 matrix by sampling from a multinomial with probability parameter 7r. What is the expected number of members for each community? For your instance of 8, what is your observed number of members for each community? Create a visualization of your 9 matrix that matches the style shown in the \"Network Models: Blockmodels and Spectral Clustering" video (slide 6). (Consider using the heatmap function from either the seaborn or graspologicplot packages) b. Create the connection probability matrix P. Create a visualization of your P matrix that matches the style shown in the \"Network Models: Blockmodels and Spectral Clustering" video (slide 6). Show this plot sideby side with your visualization of C') (Hint: Consider using the subplot function of the matpl'otlib.pyplot package). Additionally, report the values of P [1, 3] , P [197, 199] , and P [192, 4]. c. Create a random instance of your network adjacency matrix A, where A represents an undirected graph where a node is not a neighbor of itself. Create a visualization of your A matrix that matches the style shown in the \"Network Models: Blockmodels and Spectral Clustering" video (slide 6). Show this plot sidebyside with your visualization of P. d. Create a network plot representing your network adjacency matrix. Color each node according to their community assignment. (Hint: Consider using the from_numpy_matrix and draw functions from the networkx package. Additionally, to see how densely/sparsely connected the network is, consider modifying the node_size and width arguments to be small.) Report your plot. How do the connection densities of the different communities compare within communities? How do the connection densities of the different communities compare across communities? Discuss the highest and lowest connection densities when you answer these questions, The stochastic block model (Holland, Laskey and Leinhardt 1983) Community Sparsity parameter connections B Pij = p . OF BO; Binary Connection Network community probabilities Adjacenty matrix memberships P A
Step by Step Solution
There are 3 Steps involved in it

Get step-by-step solutions from verified subject matter experts