

Question: for answer, Substance Y can have a different graph than Substance Z graph.. out of these options below... Graph 1: Graph 2: Graph 3: Graph
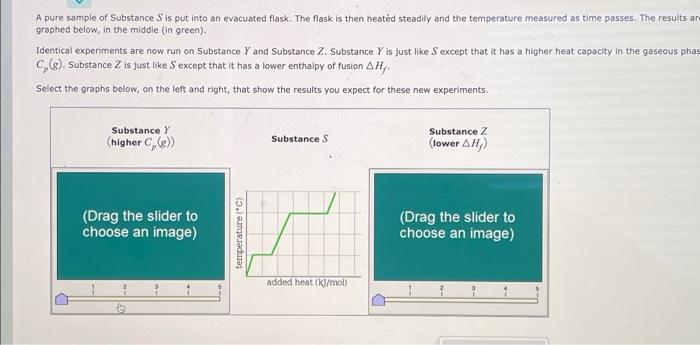
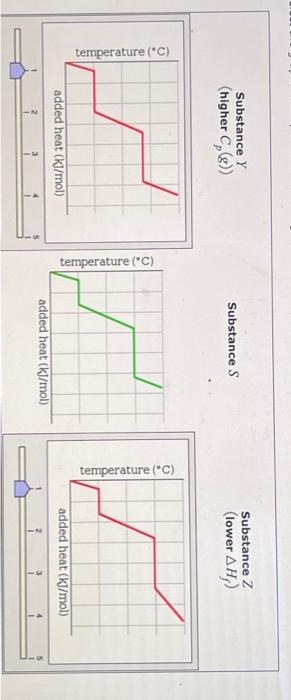
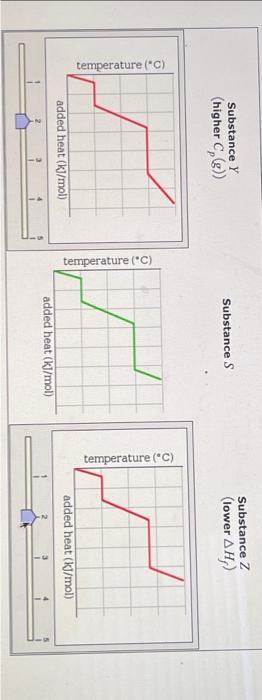
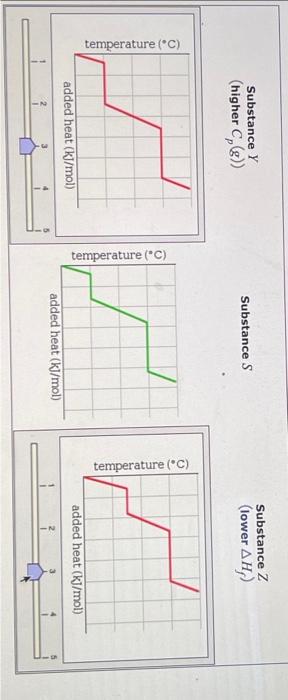
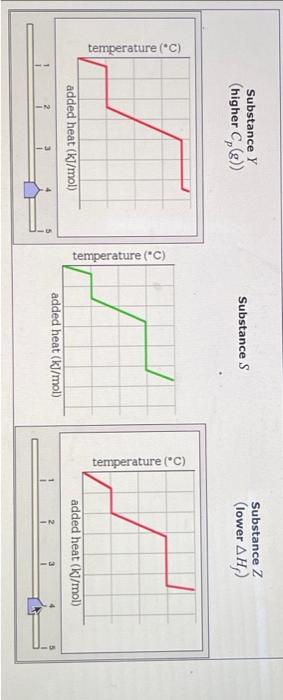
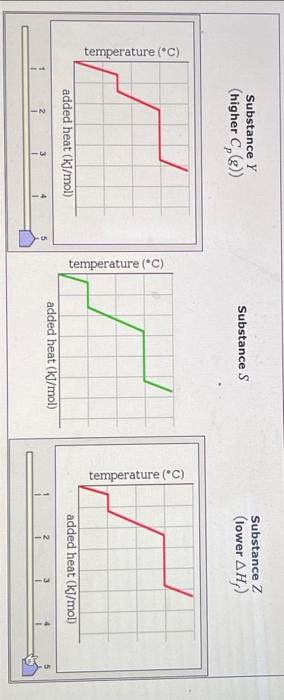
A pure sample of Substance S is put into an evacuated flask. The flask is then heated steadily and the temperature measured as time passes. The results ar graphed below, in the middle (in green). Identical experiments are now run on Substance Y and Substance Z. Substance Y is just like S except that it has a higher heat capacity in the gaseous phas Cp(g). Substance Z is just like S except that it has a lower enthalpy of fusion Hf. Select the graphs below, on the left and right, that show the results you expect for these new experiments. SubstanceY(higherCp(g)) Substance S Substance Z (lower Hf ) ) added heat (kJ/mol) Substance Z Substance Y (higher Cp(g) ) Substance S Substance Z (lower Hf ) Substance Z (lower Hf )
Step by Step Solution
There are 3 Steps involved in it

Get step-by-step solutions from verified subject matter experts