Question: For At&t, use concepts learned about the present value to estimate the value of the company's stock. See P7-3in Week 3's Homework to get an
For At&t, use concepts learned about the present value to estimate the value of the company's stock. See P7-3in Week 3's Homework to get an idea of what you should do, as well as my posted example. Note that you will need to estimate the appropriate cost of capital or discount ratefor your analysis based on the firm's risk, based on its industry, and individual characteristics.You will also need to estimate a growth rate for the firm's Dividend,as well as find what Dividend they have been paying (perhaps past Dividend history can help in estimating a growth rate). Sites such as GuruFocus and ReadyRatios may be useful. Provide explanations of how you determined each variable. Once you estimate the Stock price, compare it to the actual stock price from current markets. Comment on the comparison (is it lower or higher and why).
*P7-3 Value a Constant Growth Stock Financial analysts Use equation: Po= Do(1+g)/ (i- g)
Example and notes below:
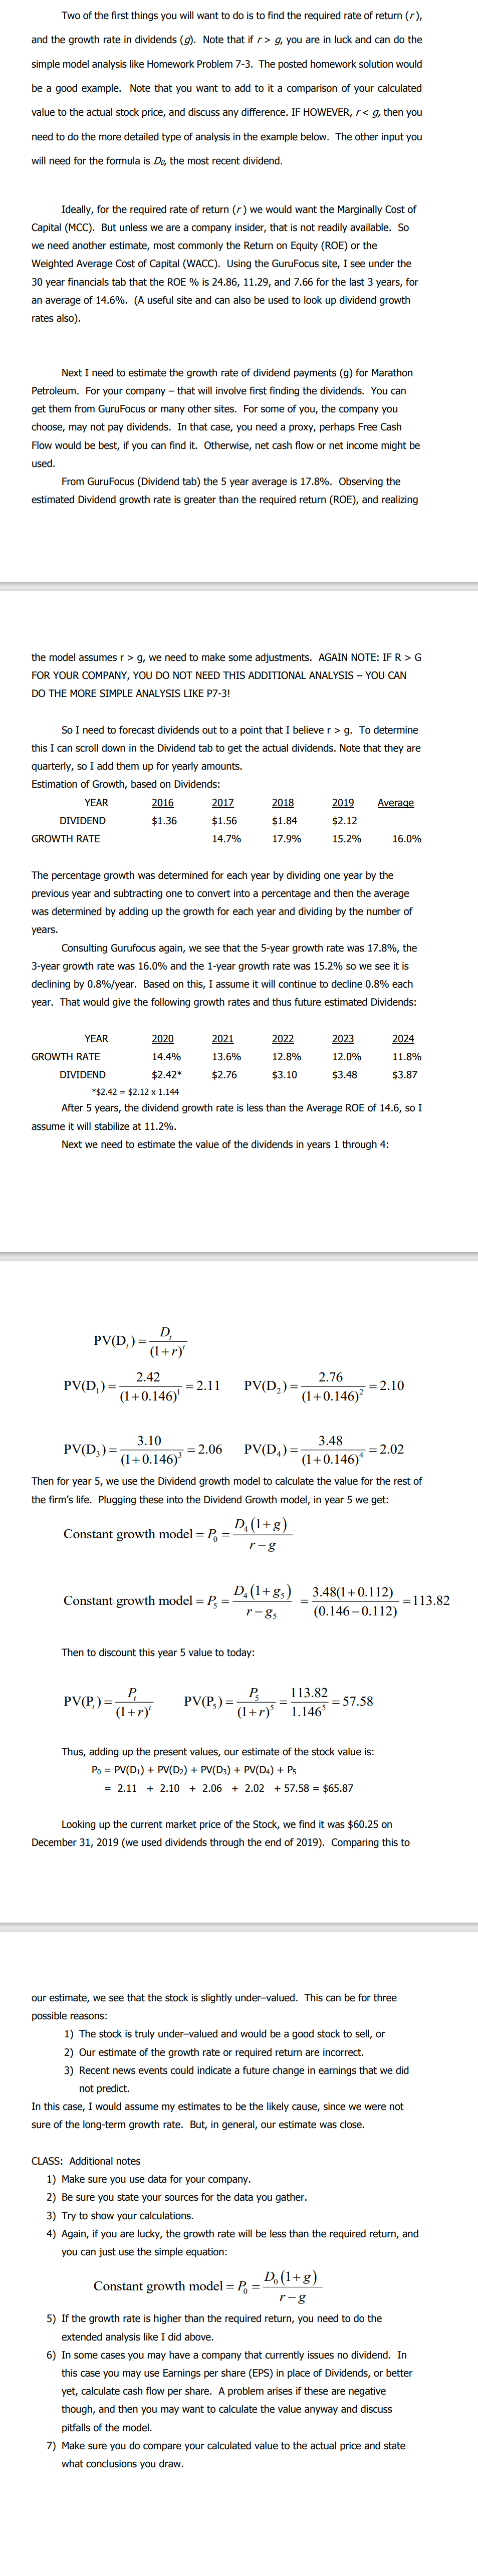
Two of the first things you will want to do is to find the required rate of return (r), and the growth rate in dividends (9). Note that if /> g, you are in luck and can do the simple model analysis like Homework Pro olution would be a good example. Note that you want to add to it a comparison of your calculated value to the actual stock price, and discuss any IF HOWEVER, / 9, we need to make some adjustments. AGAIN NOTE: IF R > G FOR YOUR COMPANY, YOU DO NOT NEED THIS ADDITIONAL ANALYSIS - YOU CAN DO THE MORE SIMPLE ANALYSIS LIKE P7-3! So I need to forecast dividends out to a point that I believe r > g. To determine this I can scroll down in the Dividend tab to get the actual dividends. Note that they are quarterly, so I add them up for yearly amounts. Estimation of Growth, based on Dividends: YEAR 2016 2012 2018 2019 Average DIVIDEND $1.36 $1.56 $1.84 $2.12 GROWTH RATE 14.7% 17.9% 15.2% 16.0% The percentage growth was determined for each year by dividing one year by the previous year and subtracting one to convert into a percentage and then the average was determined by adding up the growth for each year and dividing by the number of years. Consulting Gurufocus again, we see that the 5-year growth rate was 17.8%, the 3-year growth rate was 16.0% and the 1-year growth rate was 15.2% so we see it is declining by 0.8%/year. Based on this, I assume it ntinue to decline 0.8% each year. That would give the following growth rates and thus future estimated Dividends: YEAR 2020 2021 2022 2023 2024 GROWTH RATE 14.4% 13.6% 12.8% 12.0% 11.8% DIVIDEND $2.47 $2.76 $3.10 $3.48 $3.87 *$2.42 = $2.12 x 1.144 After 5 years, the dividend growth rate is less than the Average ROE of 14.6, so I assume it will stabilize at 11.2%. Next we need to estimate the value of the dividends in years 1 through 4: PV(D,)= (+7) 2.42 PV(D,) =7140.146 1 =2.11 PV(D2)=(14 0.146)? =2.10 PV(D;) = 7 3.10 3.48 (1+0.146)3 3 = 2.06 PV(D.) = (1+0.146)4 -=2.02 Then for year 5, we use the Dividend growth model to calculate the value for the rest of the firm's life. Plugging these into the Dividend Growth model, in year 5 we get: Constant growth model = P, = - DA (1+8) r-g Constant growth model = P = - DA (1+ 8s) _ 3.48(1+0.112) =113.82 r - 8's (0.146-0.112) Then to discount this year 5 value to today: PS _ 113.82 PV(P,)=(1+r)' PV(P's) (1+r) 1.1465 =37.58 Thus, adding up the present values, our estimate of the stock value is: Po = PV(D,) + PV(D2) + PV(D3) + PV(D4) + Ps = 2.11 + 2.10 + 2.06 + 2.02 + 57.58 = $65.87 Looking up the current market price of the Stock, we find it was $60.25 on December 31, 2019 (we used dividends through the end of 2019). Comparing this to our estimate, we see that the stock is slightly under-valued. This can be for three possible reasons: 1) The stock is truly under-valued and would be a good stock to sell, or 2) Our estimate of the growth rate or required return are incorrect. 3) Recent news events could indicate a future change in earnings that we did not predict. In this case, I would assume my estimates to be the likely cause, since we were not sure of the long-term growth rate. But, in general, our estimate was close. CLASS: Additional notes 1) Make sure you use data for your company. 2) Be sure you state your sources for the data you gather. 3) Try to show your calculations. 4) Again, if you are lucky, the growth rate will be less than the required return, and you can just use the simple equation: Constant growth model = P. = Do (1+ g) r-g 5) If the growth rate is higher than the required return, you need to do the extended analysis like I did above. 6) In some cases you may have a company that currently issues no dividend. In this casey gs per share (EPS) in place of Dividends, or better yet, calculate cash flow per share. A problem arises if these are negative hough, and then you may want to calculate the value anyway and discuss pitfalls of the model. ) Make sure you do compare your calculated value to the actual price and state what conclusions you draw
Step by Step Solution
There are 3 Steps involved in it
1 Expert Approved Answer
Step: 1 Unlock
Question Has Been Solved by an Expert!
Get step-by-step solutions from verified subject matter experts
Step: 2 Unlock
Step: 3 Unlock
Students Have Also Explored These Related Finance Questions!