

Question: For both Questions 1 and 2 , reference the cells in the accompanying Excel spreadsheet which contain numbers / calculations in support of your answer.
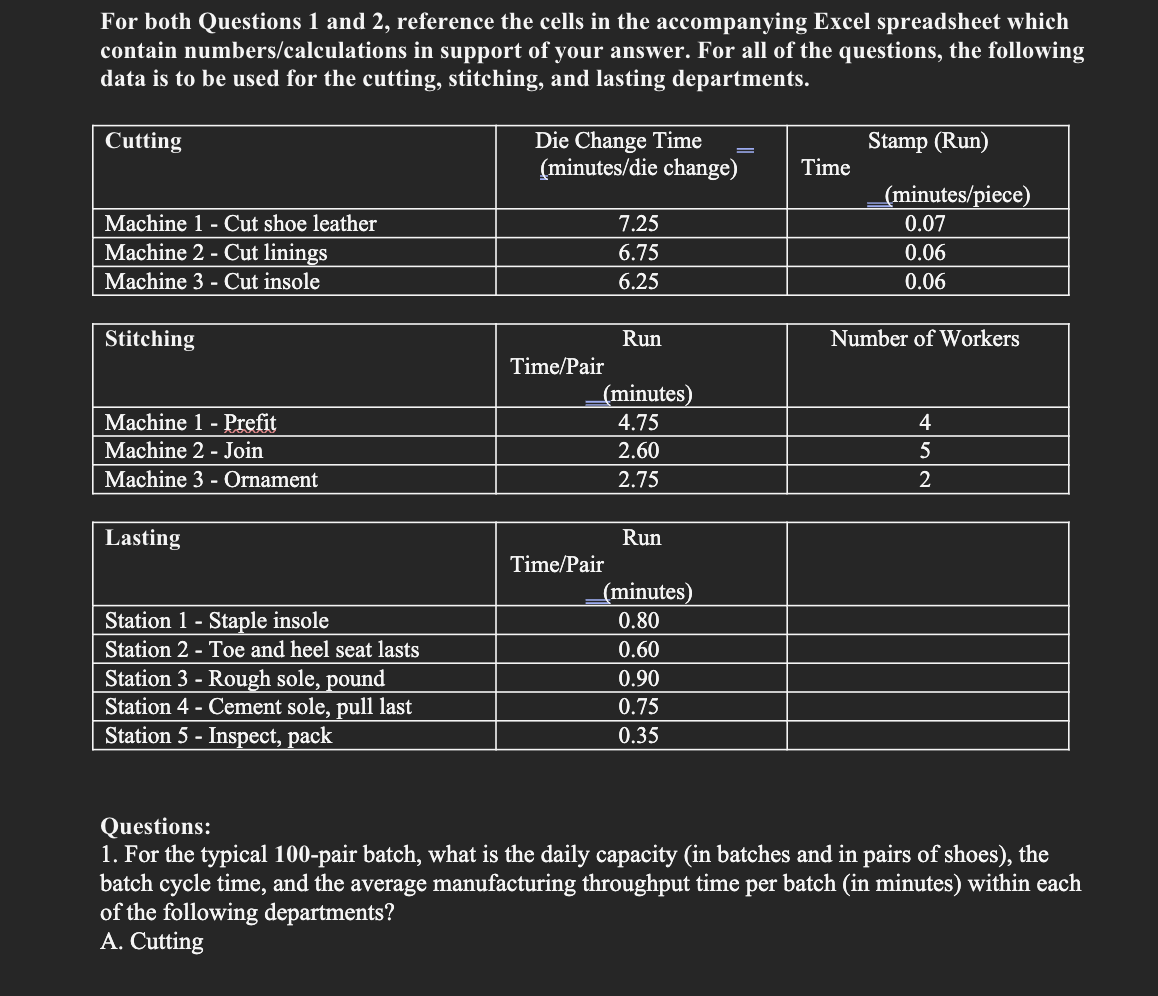
For both Questions and reference the cells in the accompanying Excel spreadsheet which contain numberscalculations in support of your answer. For all of the questions, the following data is to be used for the cutting, stitching, and lasting departments.
Questions:
For the typical pair batch, what is the daily capacity in batches and in pairs of shoes the batch cycle time, and the average manufacturing throughput time per batch in minutes within each of the following departments?
A Cutting Now consider the factory as a system, and take into account interactions between the departments. For both Questions and in addition to your explanations, reference the cells in your accompanying Excel spreadsheet which contain numberscalculations in support of your answer.
If production is done in pair batches, what is the factory's daily capacity? If the batch size is reduced to pairs, what would be the factory's daily capacity? Explain how you arrived at your conclusion. Note: The steaming oven is not a constraint since the case says that it has excess capacity.
Compute the theoretical manufacturing throughput time for a pair batch, the actual average manufacturing throughput time for a pair batch, and the throughput time efficiency for a pair batch. What does the calculated throughput time efficiency say about the performance of the factory? Do not include raw material and finished goods in your calculations WIP Total Average WIP and Total WIP between Departments
Construct two separate graphs in Excel using the scatter chart with a connected line. The first graph should show the relationship between the actual average manufacturing throughput time per batch through the factory in minutes and the batch size used ranging from pairsbatch to pairsbatch in increments of pairsbatch The second graph should show the relationship between the batch size ranging from pairsbatch to pairsbatch in increments of pairsbatch and the overall capacity of the factory in pairsday Do not include the amount of time a batch spends in raw material and finished goods in your throughput time graph. Explain what the graphs illustrate about capacity and lead time at Stonehaven. In addition, explain why the relationships shown in the two graphs occur.
Specify the relevant performance measures that must be improved at Stonehaven's Gdansk factory. Provide at least two changes in the process that you recommend in order to improve the performance of the Stonehaven Gdansk factory. For each process change that you suggest, briefly discuss which performance measures it improves, how much improvement is attained, and why. Please Note this is not optional and due to the course requirements written communication your recommendation and supporting analysis must be included in this Question.
Finally: Calculate TPT Efficiency for both of your recommendations. For clarity this will be two efficiency numbers, one for the first recommendation and then the second efficiency number will be the total of the two recommendations. See slides for more info
DO NOT SUGGEST HIRING MORE WORKERS This will NOT COUNT. You CAN move workers around. You can suggest changing batch sizes All suggestions have to be backed up by your data and shown on a separate TAB.
Step by Step Solution
There are 3 Steps involved in it
1 Expert Approved Answer
Step: 1 Unlock

Question Has Been Solved by an Expert!
Get step-by-step solutions from verified subject matter experts
Step: 2 Unlock
Step: 3 Unlock