

Question: For crossover: 1. If the MACD has recently crossed over the signal line from below, this is a bullish signal. Write bullish in the crossover
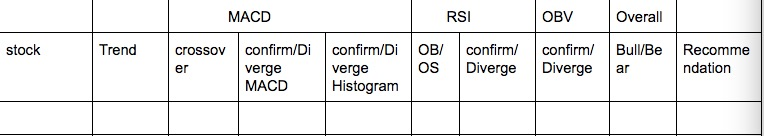
For crossover:
1. If the MACD has recently crossed over the signal line from below, this is a bullish signal. Write bullish in the crossover column.
2. If the MACD has recently crossed over the signal line from above, this is a bearish signal. Write bearish in the crossover column.
3. If there hasnt been a crossover recently, dont write anything in the crossover cell.
For the MACD divergence/ confirmation signal, you will compare the recent slope of the MACD or histogram to the recent price trend of the stock. The scenarios and signal are as follows:
1. If the stock trend is up and the slope of the MACD/histogram is up, then this is bullish.
2. If the stock trend is up and the slope of the MACD/histogram is flat to down, then this is bearish.
3. If the stock trend is down and the slope of the MACD/histogram is down, then this is bearish.
4. If the stock trend is down and the slope of the MACD/histogram is up, then this is bullish.
For the RSI analysis, there are two signals to look for: overbought/oversold and divergence/confirmation.
For the overbought/oversold signal:
1. If RSI > 70, the stock is overbought and the signal is bearish
2. If RSI
3. If the RSI is between 30 and 70, dont write anything in this cell
For the RSI divergence/ confirmation signal, you will compare the recent slope of the RSI to the recent price trend of the stock. The scenarios and signal are as follows:
1. If the stock trend is up and the slope of the RSI is up, then this is bullish.
2. If the stock trend is up and the slope of the RSI is flat to down, then this is bearish.
3. If the stock trend is down and the slope of the RSI is down, then this is bearish.
4. If the stock trend is down and the slope of the RSI is up, then this is bullish.
For On-Balanced Volume, you will look for a divergence/ confirmation signal. You will compare the recent slope of the OBV to the recent price trend of the stock. The scenarios and signal are as follows:
1. If the stock trend is up and the slope of the OBV is up, then this is bullish.
2. If the stock trend is up and the slope of the OBV is flat to down, then this is bearish.
3. If the stock trend is down and the slope of the OBV is down, then this is bearish.
4. If the stock trend is down and the slope of the OBV is up, then this is bullish.
For your write-up, I want to see a table similar to the one above that compares the four stocks. You will then add up the total number of bullish and bearish signals including the price trend. You will recommend the one stock from the four that you would buy and the one stock from the four that you will sell (or short). The following guidelines will help you determine the buy and sell:
- The buy is the stock with either:
- The highest number of bullish signals or
- The least number of bearish signals
- The sell is the stock with either:
- The highest number of bearish signals or
- The least number of bullish signals
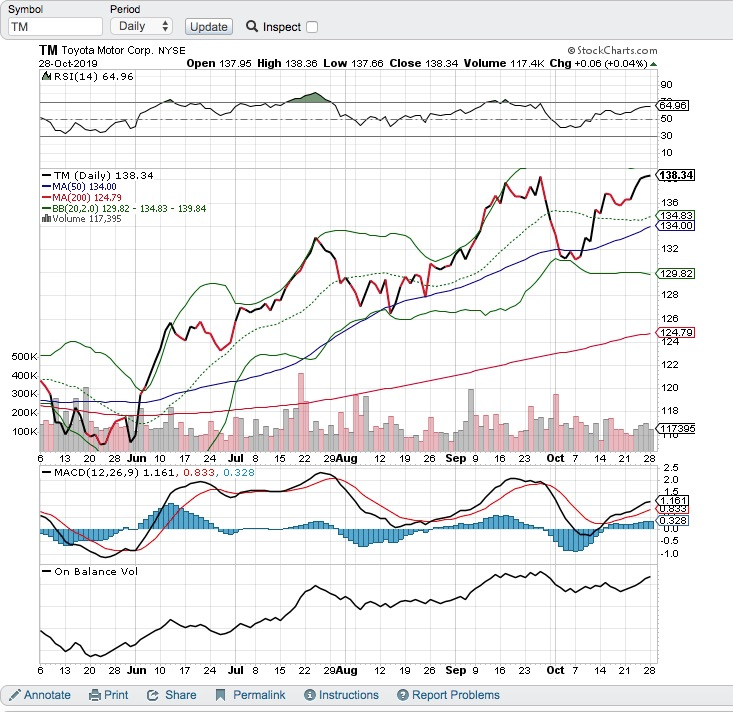
MACD RSI Overall stock Trend crossov confirm/Di verge MACD confirm/Di verge Histogram OBI OS confirm/ Diverge OBV confirm/ Diverge Bull/Be ar er Recomme ndation Symbol Period TM Daily Update Inspecto TM Toyota Motor Corp. NYSE StockCharts.com 28-Oct-2019 Open 137.95 High 138.36 Low 137.66 Close 138.34 Volume 117.4K Chg +0.06 (+0.04%) MRSI(14) 64.96 50 10 138.34 - TM (Daily) 138.34 -MA(50) 134.00 -MA(200) 124.79 -BB(20,2.0) 129.82 - 134.83 - 139.84 in Volume 117,395 136 134.83 134.00 132 129.82 128 126 122 120 500K 400K 300K 200K 100K 118 117395 6 13 20 28 Jun 10 17 24 Jul 8 - MACD(12,26,9) 1.161, 0.833, 0.328 15 22 29Aug 12 19 26 Sep 9 16 23 Oct 7 14 21 28 2.5 2.0 15 1.161 9.833 0.328 -0.5 - 1.0 -On Balance Vol 20 24 22 23 Oct 7 14 21 28 6 13 Annotate 28 Jun 10 17 Print Share Jul 8 15 Permalink 29Aug 12 Instructions 19 26 Sep 9 16 Report Problems MACD RSI Overall stock Trend crossov confirm/Di verge MACD confirm/Di verge Histogram OBI OS confirm/ Diverge OBV confirm/ Diverge Bull/Be ar er Recomme ndation Symbol Period TM Daily Update Inspecto TM Toyota Motor Corp. NYSE StockCharts.com 28-Oct-2019 Open 137.95 High 138.36 Low 137.66 Close 138.34 Volume 117.4K Chg +0.06 (+0.04%) MRSI(14) 64.96 50 10 138.34 - TM (Daily) 138.34 -MA(50) 134.00 -MA(200) 124.79 -BB(20,2.0) 129.82 - 134.83 - 139.84 in Volume 117,395 136 134.83 134.00 132 129.82 128 126 122 120 500K 400K 300K 200K 100K 118 117395 6 13 20 28 Jun 10 17 24 Jul 8 - MACD(12,26,9) 1.161, 0.833, 0.328 15 22 29Aug 12 19 26 Sep 9 16 23 Oct 7 14 21 28 2.5 2.0 15 1.161 9.833 0.328 -0.5 - 1.0 -On Balance Vol 20 24 22 23 Oct 7 14 21 28 6 13 Annotate 28 Jun 10 17 Print Share Jul 8 15 Permalink 29Aug 12 Instructions 19 26 Sep 9 16 Report Problems
Step by Step Solution
There are 3 Steps involved in it

Get step-by-step solutions from verified subject matter experts