

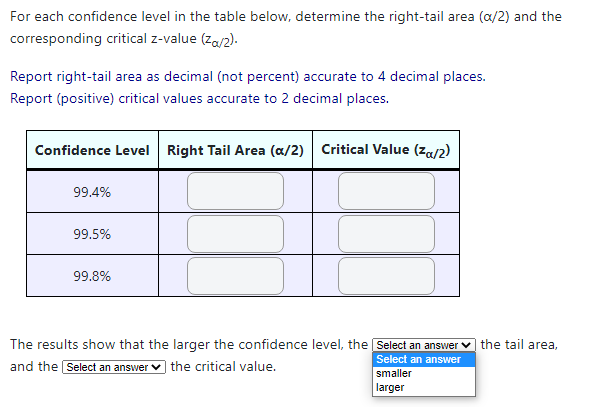
Question: For each condence level in the table belowr determine the righttail area [[119] and the corresponding critical zvalue {Ema}. Report right-tail area as decimal [not
![area [[119] and the corresponding critical zvalue {Ema}. Report right-tail area as](https://dsd5zvtm8ll6.cloudfront.net/si.experts.images/questions/2024/09/66ef423bdc837_09166ef423bc8be4.jpg)
For each condence level in the table belowr determine the righttail area [[119] and the corresponding critical zvalue {Ema}. Report right-tail area as decimal [not percent} accurate to 4 decimal places. Report {positive} critical 1.ralues accurate to 2 decimal places. -_l:l The results show that the larger the confidence level. the the tail area, and the the critical value. The confidence interval for the population mean is often presented as Lower Limit at: ,u {1 Upper Lim t or :E :l: ME [Sample Mean :l: Margin of Error] Use your knowledge of the condence interval to determine the missing 1.ralues for the 3 condence intervals in the table below. Report answers accurate to 2 [two] decimal places. Sam MPIE Margin Lower Upper of Error Limit Limit
Step by Step Solution
There are 3 Steps involved in it

Get step-by-step solutions from verified subject matter experts