

Question: For each data set (x1, x2, x3, x4) use the centered difference calculation presented in class of Dx/Dt to calculate: (1) the resulting velocity v,


For each data set (x1, x2, x3, x4) use the centered difference calculation presented in class of Dx/Dt to calculate: (1) the resulting velocity v, and (2) Dv/Dt to calculate the resulting acceleration a. Next, produce a set of position vs time, velocity vs time, and acceleration vs time graphs for each of the 4 data sets. Make sure each of your graphs contains a title indicating what is plotted in that graph, along with axis titles indicating the quantity and measurement unit plotted along that axis. Use the Excel.
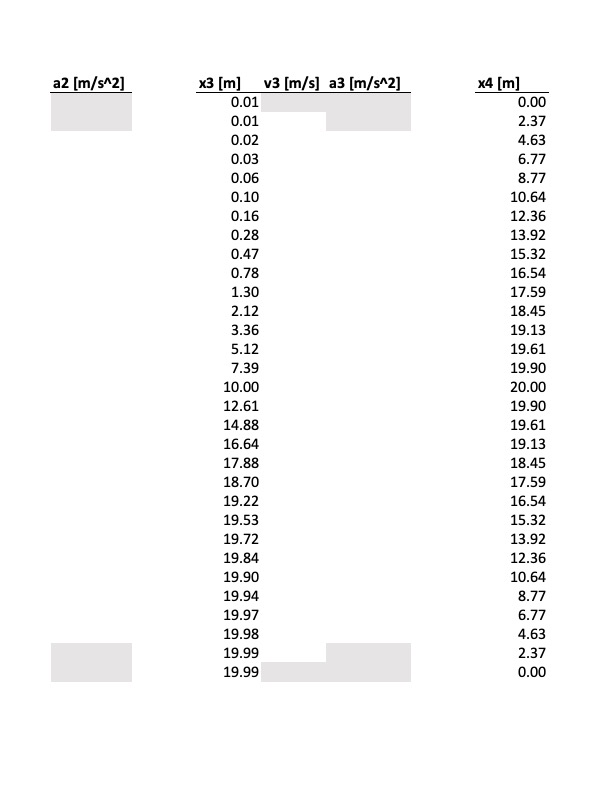

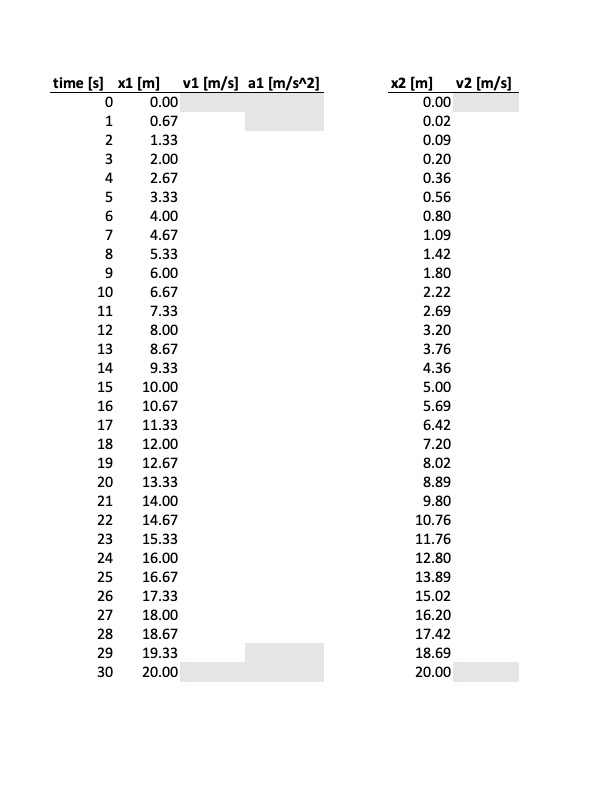
\fv4 [m/s] a4 [m/s^2]time [s] x1 [m] v1 [m/s] a1 [m/s^2] x2 [m] v2 [m/s] 0.00 0.00 0.67 0.02 1.33 0.09 2.00 0.20 2.67 0.36 DOYOUAWNAC 3.33 0.56 4.00 0.80 4.67 1.09 5.33 1.42 6.00 1.80 10 6.67 2.22 11 7.33 2.69 12 8.00 3.20 13 8.67 3.76 14 9.33 4.36 15 10.00 5.00 16 10.67 5.69 17 11.33 6.42 18 12.00 7.20 19 12.67 8.02 20 13.33 8.89 21 14.00 9.80 22 14.67 10.76 23 15.33 11.76 24 16.00 12.80 25 16.67 13.89 26 17.33 15.02 27 18.00 16.20 28 18.67 17.42 29 19.33 18.69 30 20.00 20.00
Step by Step Solution
There are 3 Steps involved in it

Get step-by-step solutions from verified subject matter experts