

Question: For each distribution shown below, imagine that the values along the horizontal axis represent the scores of students on an exam in a certain class.

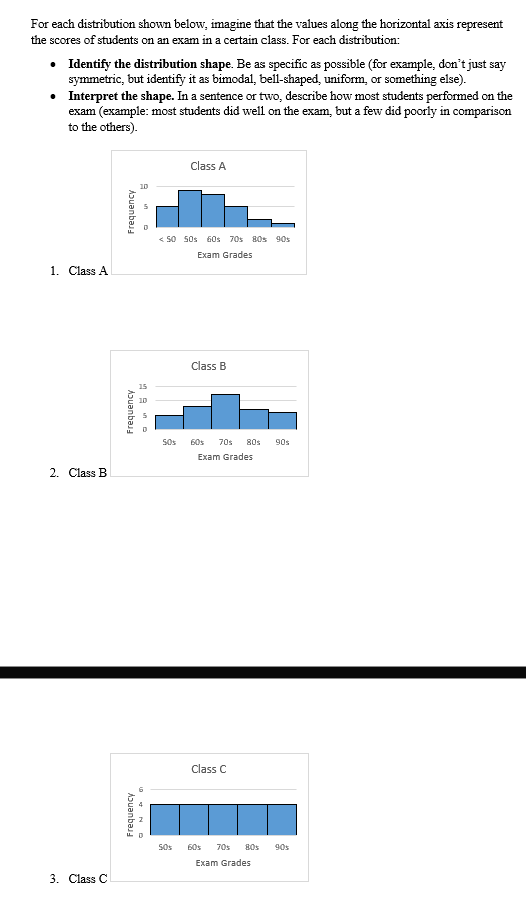
For each distribution shown below, imagine that the values along the horizontal axis represent the scores of students on an exam in a certain class. For each distribution: . Identify the distribution shape. Be as specific as possible (for example, don't just say symmetric, but identify it as bimodal, bell-shaped, uniform, or something else). . Interpret the shape. In a sentence or two, describe how most students performed on the exam (example: most students did well on the exam, but a few did poorly in comparison to the others). Class A 10 5 Frequency 4 50 50s 60s 70s 805 905 Exam Grades 1. Class A Class B 15 Frequency 505 605 70s 80s 90s Exam Grades 2. Class B Class C Frequency 505 605 70s BOS Exam Grades 3. Class C
Step by Step Solution
There are 3 Steps involved in it

Get step-by-step solutions from verified subject matter experts