

Question: For each graph below a. Explain how it is misleading using terminology from the previous page if possible b. Describe what a reader might
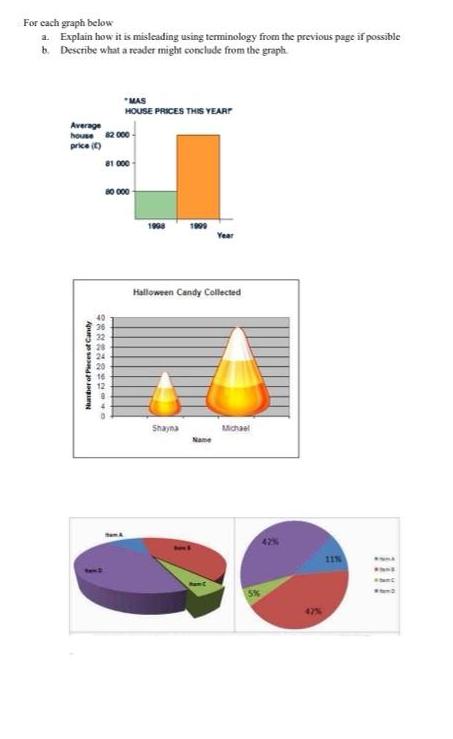
For each graph below a. Explain how it is misleading using terminology from the previous page if possible b. Describe what a reader might conclude from the graph. Average house 82 000 price (1) Number of Pieces of Candy 982228RROYO 80 000 40 26 32 24 MAS HOUSE PRICES THIS YEAR 20 81.000 16 1998 1999 Shayna Halloween Candy Collected Year Name Michael 42% 47% 11%
Step by Step Solution
★★★★★
3.55 Rating (148 Votes )
There are 3 Steps involved in it
1 Expert Approved Answer
Step: 1 Unlock

Solution First graph a The bar graph is misleading because it lacks a baseline starting at zero This ... View full answer
Question Has Been Solved by an Expert!
Get step-by-step solutions from verified subject matter experts
Step: 2 Unlock
Step: 3 Unlock