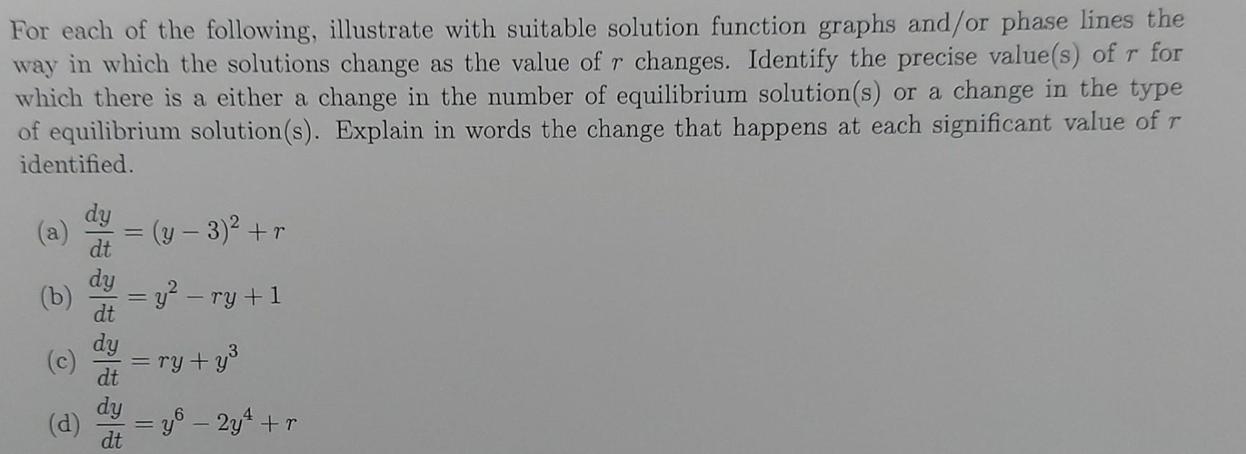
Question: For each of the following, illustrate with suitable solution function graphs and/or phase lines the way in which the solutions change as the value

For each of the following, illustrate with suitable solution function graphs and/or phase lines the way in which the solutions change as the value of r changes. Identify the precise value(s) of r for which there is a either a change in the number of equilibrium solution(s) or a change in the type of equilibrium solution (s). Explain in words the change that happens at each significant value of r identified. O (d) dy dt (y - 3) + r = yr - ry + 1 ry+y = y6 2y + r
Step by Step Solution
3.35 Rating (155 Votes )
There are 3 Steps involved in it
To illustrate the changes in the solutions for each differential equation as the value of r changes we will plot solution function graphs andor phase lines Lets analyze each equation separately a ddty ... View full answer

Get step-by-step solutions from verified subject matter experts


