

Question: For each of the time? series, construct a line chart of the data and identify the characteristics of the time series? (that is,? random, stationary,?
For each of the time? series, construct a line chart of the data and identify the characteristics of the time series? (that is,? random, stationary,? trend, seasonal, or? cyclical).
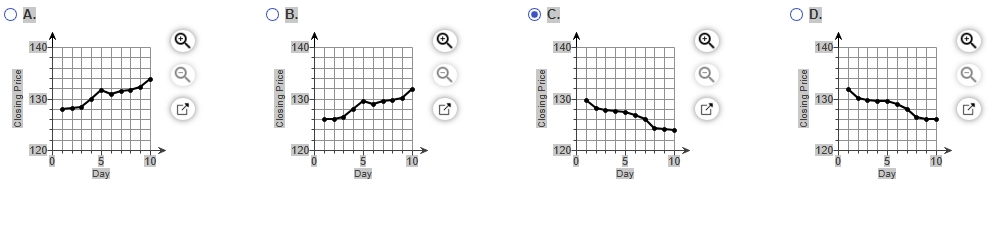
Date IBM 9/7/2010 $125.95 9/8/2010 $126.08 9/9/2010 $126.36 9/10/2010 $127.99 9/13/2010 $129.61 9/14/2010 $128.85 9/15/2010 $129.43 9/16/2010 $129.67 9/17/2010 $130.19 9/20/2010 $131.79
Construct a line chart of the closing stock prices data. Choose the correct chart below.
Step by Step Solution
There are 3 Steps involved in it
1 Expert Approved Answer
Step: 1 Unlock

Question Has Been Solved by an Expert!
Get step-by-step solutions from verified subject matter experts
Step: 2 Unlock
Step: 3 Unlock