

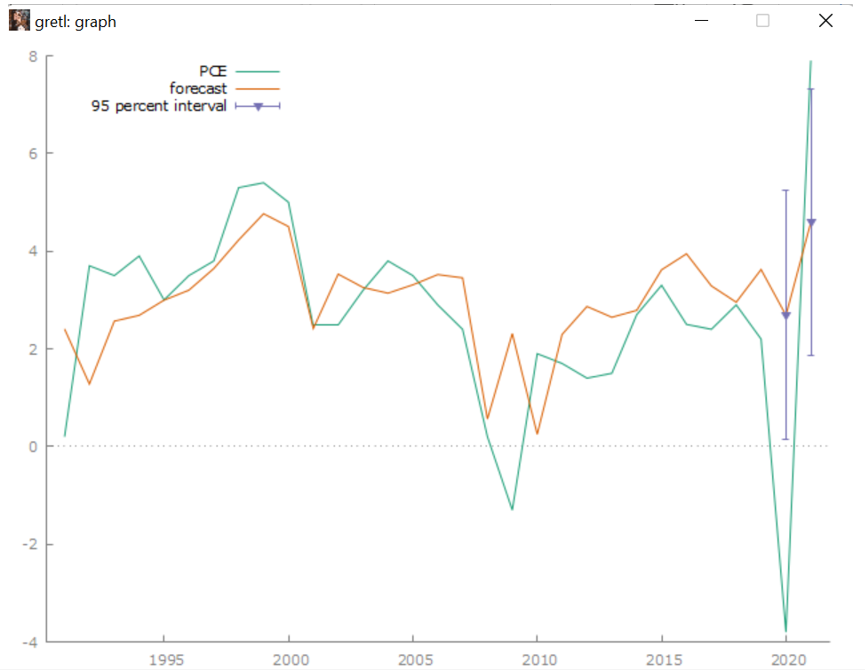
Question: For each post-sample forecasted value, GRETL provides a 95% confidence interval that is represented by the green error bars in the plot. Are the actual
For each post-sample forecasted value, GRETL provides a 95% confidence interval that is
represented by the green error bars in the plot. Are the actual inflation values for 2020 and
2021 within the error bars for these forecasts?
= =
Step by Step Solution
There are 3 Steps involved in it
1 Expert Approved Answer
Step: 1 Unlock

Question Has Been Solved by an Expert!
Get step-by-step solutions from verified subject matter experts
Step: 2 Unlock
Step: 3 Unlock