

Question: For each program, please also provide your own testing cases. submit your programs and running results. Using what we have learned in Unit4 of Numpy
For each program, please also provide your own testing cases. submit your programs and running results. 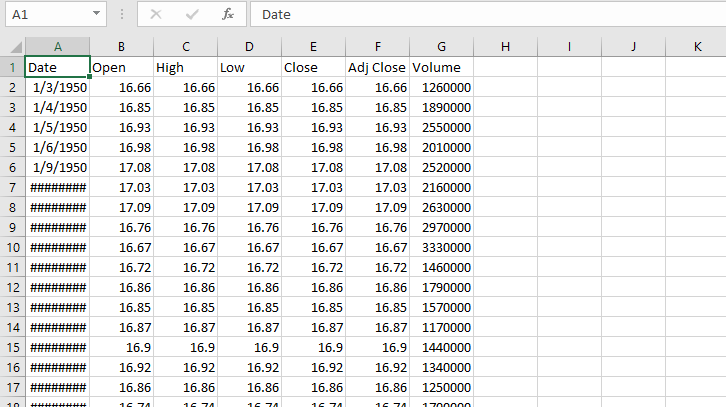 Using what we have learned in Unit4 of Numpy to analyze SP500.csv file with Numpy array operations. Please find answers to the following questions: the highest daily gain and its date, the highest daily loss and its date, the most daily transaction volume and its date, a monthly report for year 2017-2018, which has monthly average open price, close price, transaction volume and gain/loss, and a query to find all of the months which have certain range of open prices a yearly report which has annual average open price, close price, transaction volume and gain/loss from 1950 to 2018, and the most profitable year, a every other five year report which has every five year average open price, close price, transaction volume and gain/loss from 1950 to 2018, and the most profitable five year,
1 Date 0 Open High Close Adi Close Volume 1 Date 2 1/3/1950 16.66 16.66 16.6616.6616.66 1260000 3 1/4/1950 16.85 16.85 16.8516.85 16.85 1890000 4 1/5/1950 16.9316.93 16.9316.9316.93 2550000 5 1/6/1950 16.9816.98 16.9816.9816.98 2010000 6 1/9/1950 17.08 17.08 17.0817.0817.08 2520000 Low 2 16.67 16.72 16.67 16.67 16.72 16.6 7 16.67 3330000 16.72 1460000 16.72 16.72 16.9 16.9 16.9 16.9 16.9 1440000 1 Date 0 Open High Close Adi Close Volume 1 Date 2 1/3/1950 16.66 16.66 16.6616.6616.66 1260000 3 1/4/1950 16.85 16.85 16.8516.85 16.85 1890000 4 1/5/1950 16.9316.93 16.9316.9316.93 2550000 5 1/6/1950 16.9816.98 16.9816.9816.98 2010000 6 1/9/1950 17.08 17.08 17.0817.0817.08 2520000 Low 2 16.67 16.72 16.67 16.67 16.72 16.6 7 16.67 3330000 16.72 1460000 16.72 16.72 16.9 16.9 16.9 16.9 16.9 1440000
Step by Step Solution
There are 3 Steps involved in it

Get step-by-step solutions from verified subject matter experts