

Question: For each residual plot, identify which assumption has been violated, if any. a. The residuals do not appear to be normally distributed. b. No assumptions
For each residual plot, identify which assumption has been violated, if any.
a. The residuals do not appear to be normally distributed.
b. No assumptions have been violated.
c. The variability of points around the least-squares line is not roughly constant.
d. The data does not appear to be from independent observations.
e. The relationship between x and y cannot be assumed to be linear.
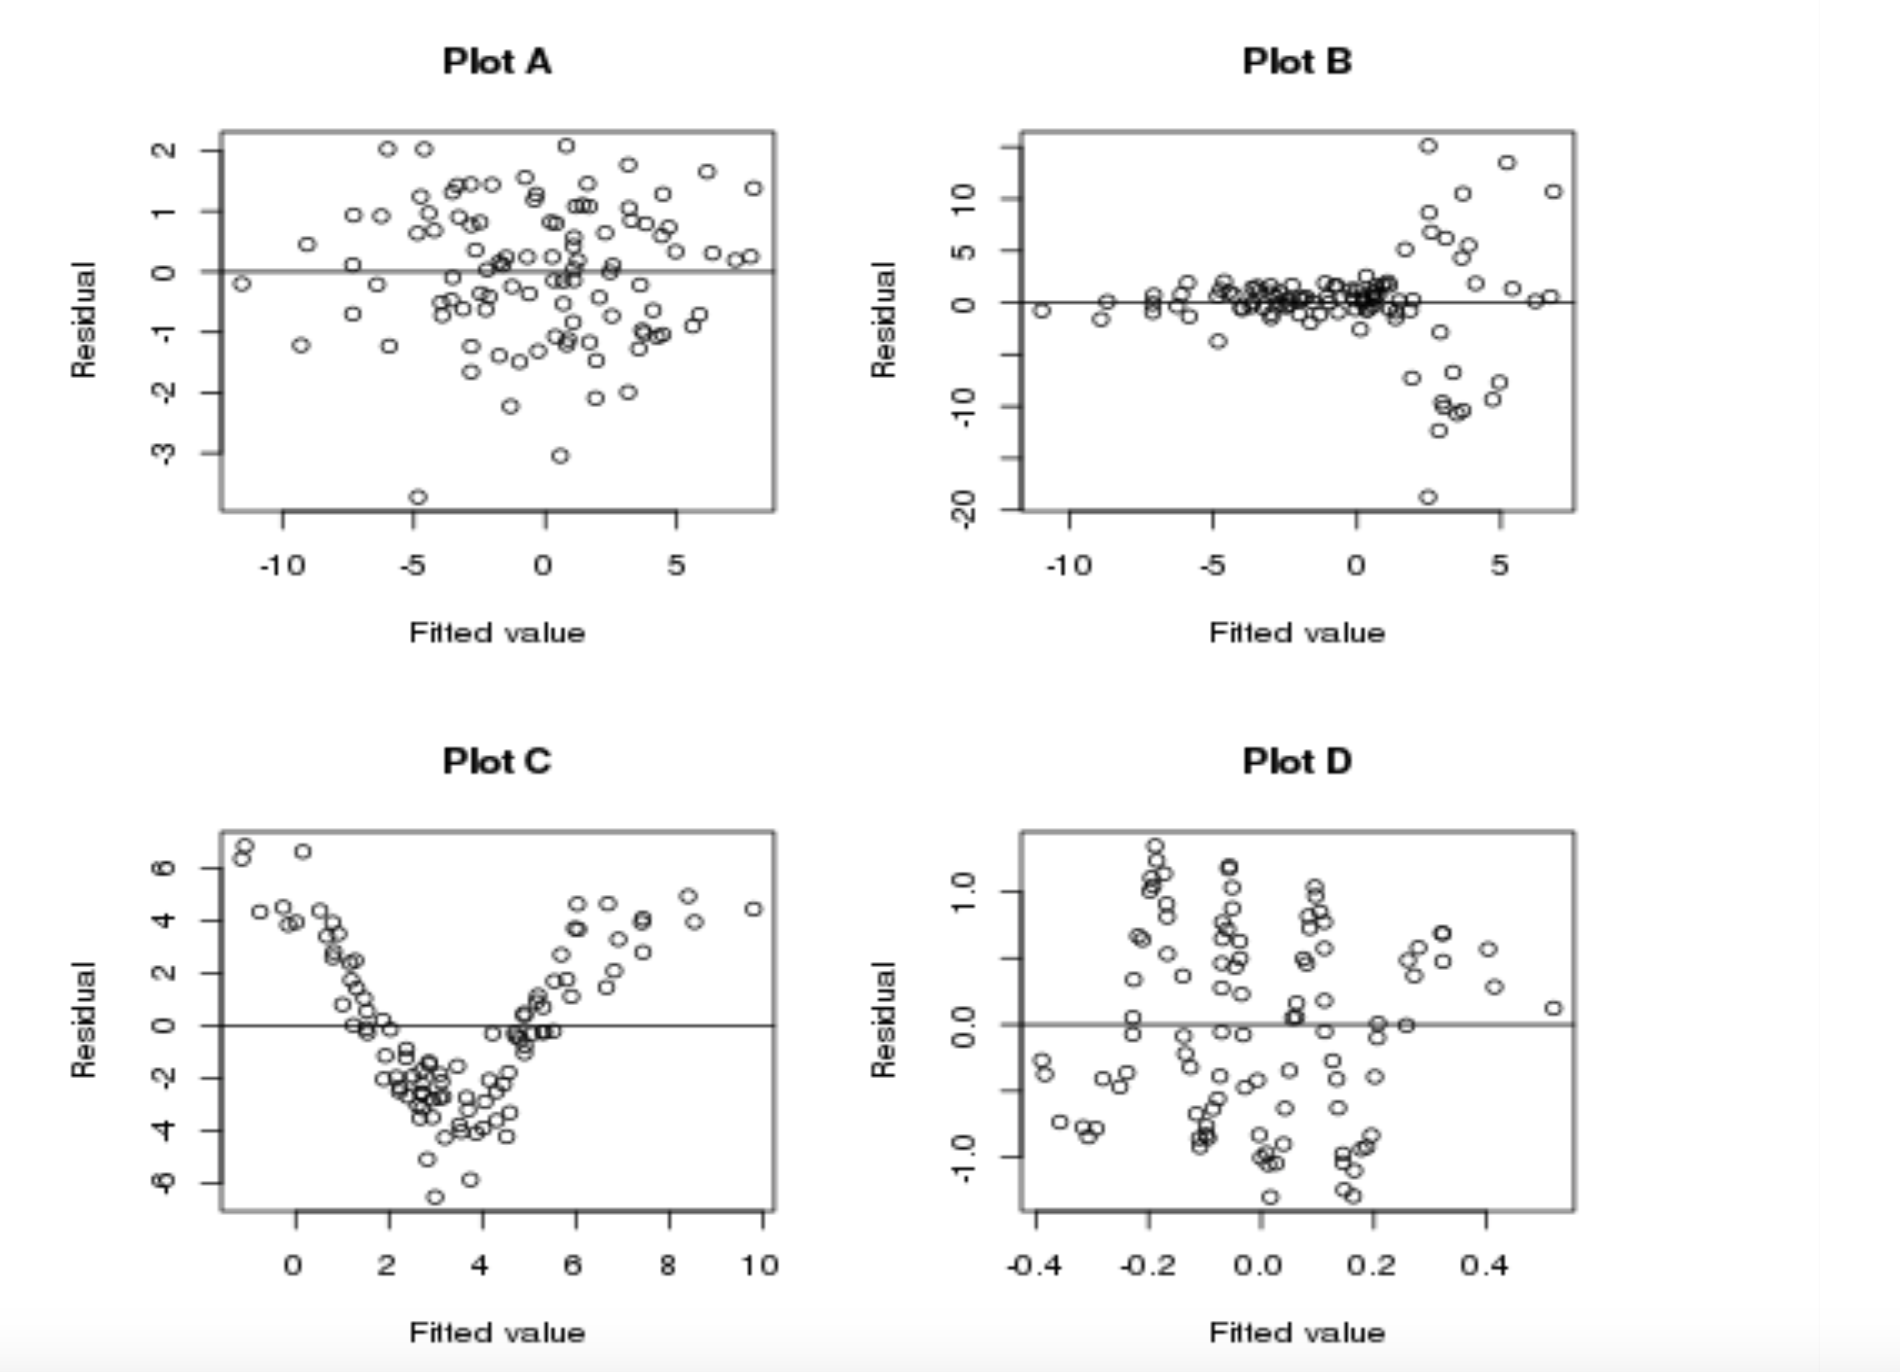
Plot A Plot B OO O O Residual O CO O O Residual 0 5 10 O O O O -10 -5 0 5 -10 -5 0 5 Fitted value Filled value Plot C Plot D 8 O 6 4 2 0 2 4 O O O 1.0 Residual Residual 0 0 0D" BOO O ob 0.0 888boo 8 o bo 0 0 -1. O 2 6 8 10 -0.4 -0.2 0.0 0.2 0.4 Filled value Filled value
Step by Step Solution
There are 3 Steps involved in it

Get step-by-step solutions from verified subject matter experts