

For each row in all 4 columns, add the number of heads (0-4 heads) for each row,
Question:
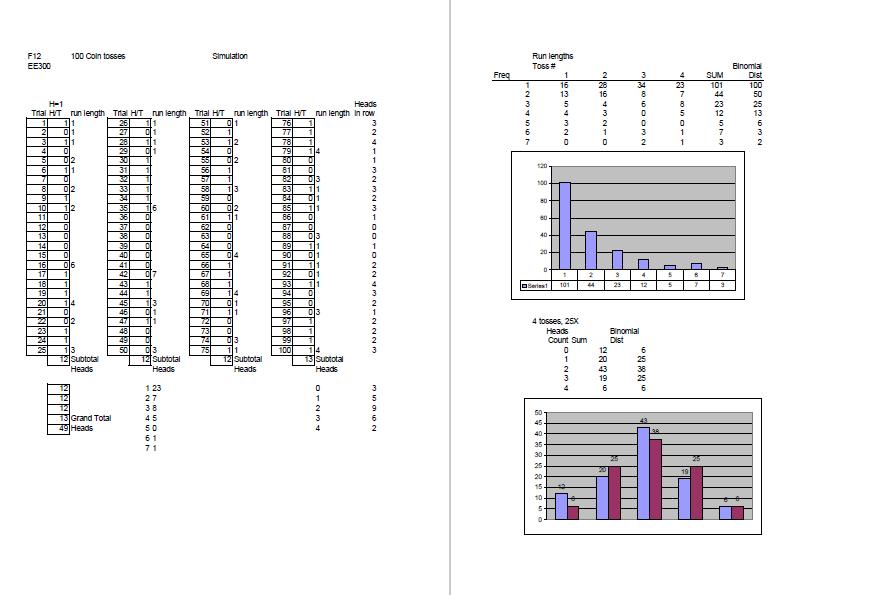
For each row in all 4 columns, add the number of heads (0-4 heads) for each row, and plot that on a histogram. Contrast the actual values with the expected values based on a binomial distribution for sets of 4 coin tosses.
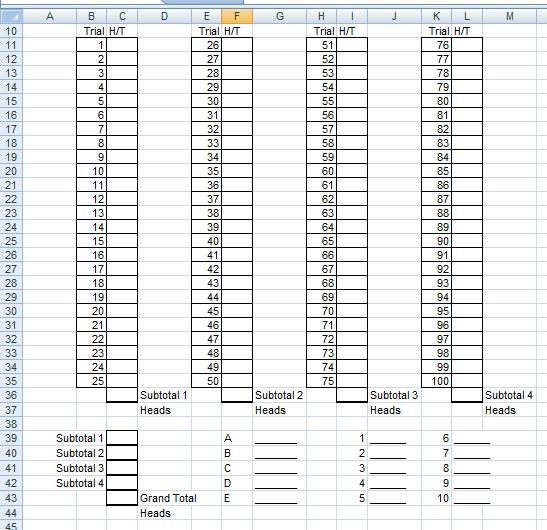
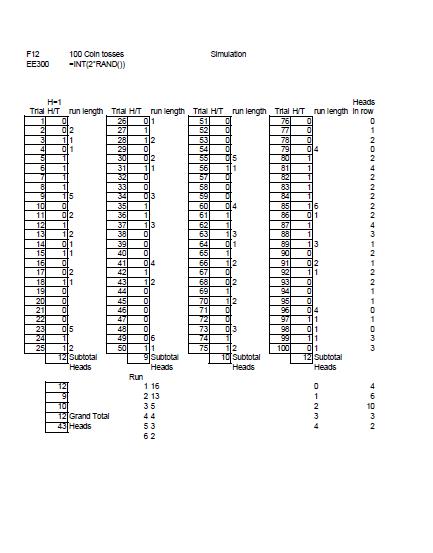
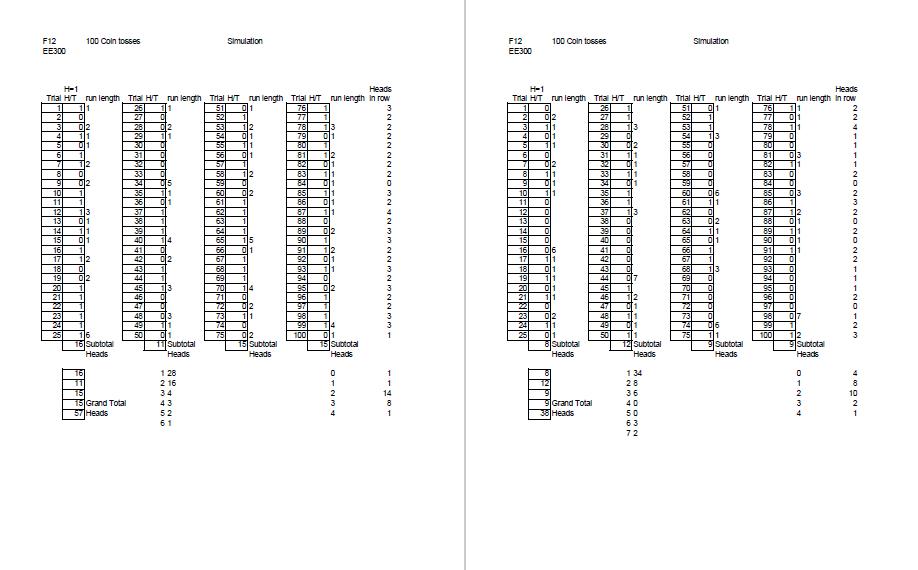
For your entire sequence, count the number of occurrences of the run lengths (1 heads, 2 heads in a row, 3 heads in a row, etc.) and graph that distribution histogram. See the sample empty CoinTossForm.xls file(1st image) and the example CoinTossSim4x.pdf file (other 3 images) shows the results for a combined set of four simulated 100 coin toss experiments.
The observed Run-length PDF can be approximated by a binomial distribution, but it is actually a different probability distribution function. Identify the type of distribution and include it in your report.
Much greater than 100 tosses is required to obtain a reasonable approximation of the binomial distribution.
See the sample PDF file "CoinTossSim4x.pdf" (other 3 images)for a general idea of what you need to do. You must calculate the theoretical probability of getting 0-4 heads for 4 tosses and simulate at least 25 2,500 sets of 4 coin tosses (total of 10,000 samples minimum) and compare the frequencies against the theoretical binomial distribution. Both the calculated and experimental simulation PDF and CDF values for both the groups of 4 and the run length must be plotted in MATLAB using histograms.
Expert Answer:


Statistics for Business and Economics
ISBN: 978-0132930192
8th edition
Authors: Paul Newbold, William Carlson, Betty Thorne
