

Question: For each variable depicted in histograms below, choose the most plausible value of corresponding statistic. Mean O 20 O 35 150 - O 50 SD
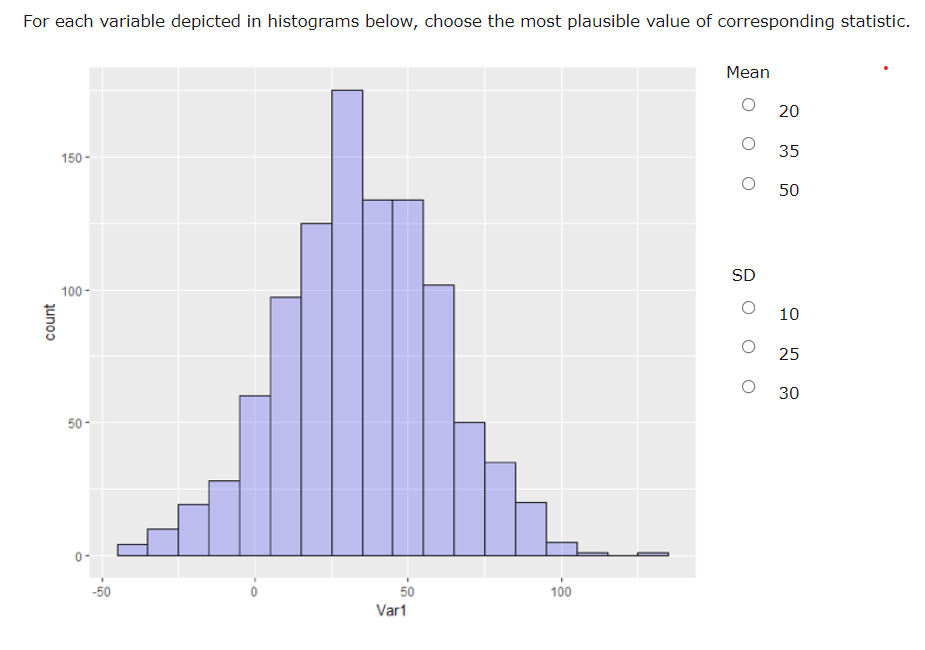

For each variable depicted in histograms below, choose the most plausible value of corresponding statistic. Mean O 20 O 35 150 - O 50 SD 100 - O 10 count O 25 O 30 50 - 0 - 50 100 -50 Var1
Step by Step Solution
There are 3 Steps involved in it
1 Expert Approved Answer
Step: 1 Unlock

Question Has Been Solved by an Expert!
Get step-by-step solutions from verified subject matter experts
Step: 2 Unlock
Step: 3 Unlock