

Question: For following elementary, reversible, liquid phase reaction AharrP a ) Draw the equilibrium conversion versus temperature graph ( You can have 0 - 2 0
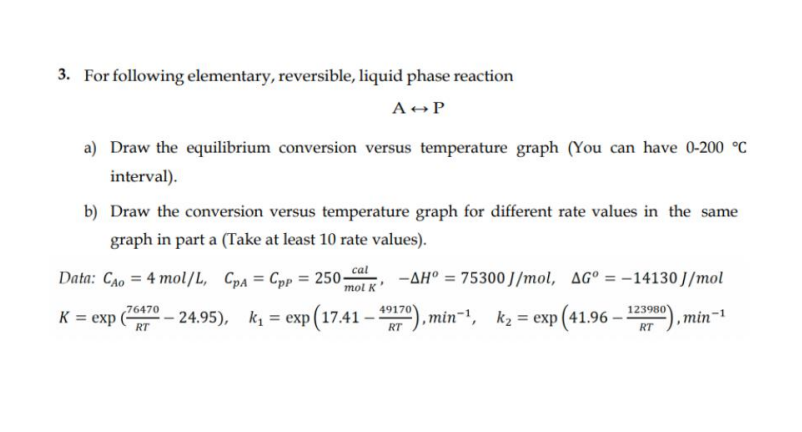
For following elementary, reversible, liquid phase reaction
AharrP
a Draw the equilibrium conversion versus temperature graph You can have
interval
b Draw the conversion versus temperature graph for different rate values in the same
graph in part a Take at least rate values
Data:
expexpminexpmin
Step by Step Solution
There are 3 Steps involved in it
1 Expert Approved Answer
Step: 1 Unlock

Question Has Been Solved by an Expert!
Get step-by-step solutions from verified subject matter experts
Step: 2 Unlock
Step: 3 Unlock