

Question: For full marks, you must include a print - out of the R code and relevant plots in your assignment. This assignment involves elevation data
For full marks, you must include a printout of the code and relevant plots in your
assignment.
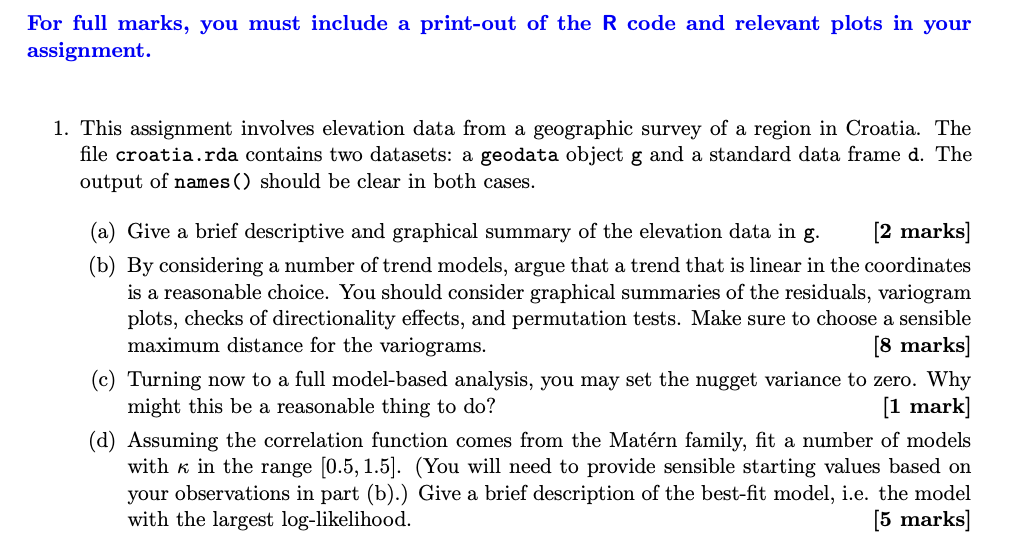
This assignment involves elevation data from a geographic survey of a region in Croatia. The
file croatia.rda contains two datasets: a geodata object and a standard data frame The
output of names should be clear in both cases.
a Give a brief descriptive and graphical summary of the elevation data in g marks
b By considering a number of trend models, argue that a trend that is linear in the coordinates
is a reasonable choice. You should consider graphical summaries of the residuals, variogram
plots, checks of directionality effects, and permutation tests. Make sure to choose a sensible
maximum distance for the variograms.
marks
Step by Step Solution
There are 3 Steps involved in it
1 Expert Approved Answer
Step: 1 Unlock

Question Has Been Solved by an Expert!
Get step-by-step solutions from verified subject matter experts
Step: 2 Unlock
Step: 3 Unlock