

Question: for G F D B A C E Accord Control Charts: X-bar and R Charts In order to create X-bar and R-charts for a process,
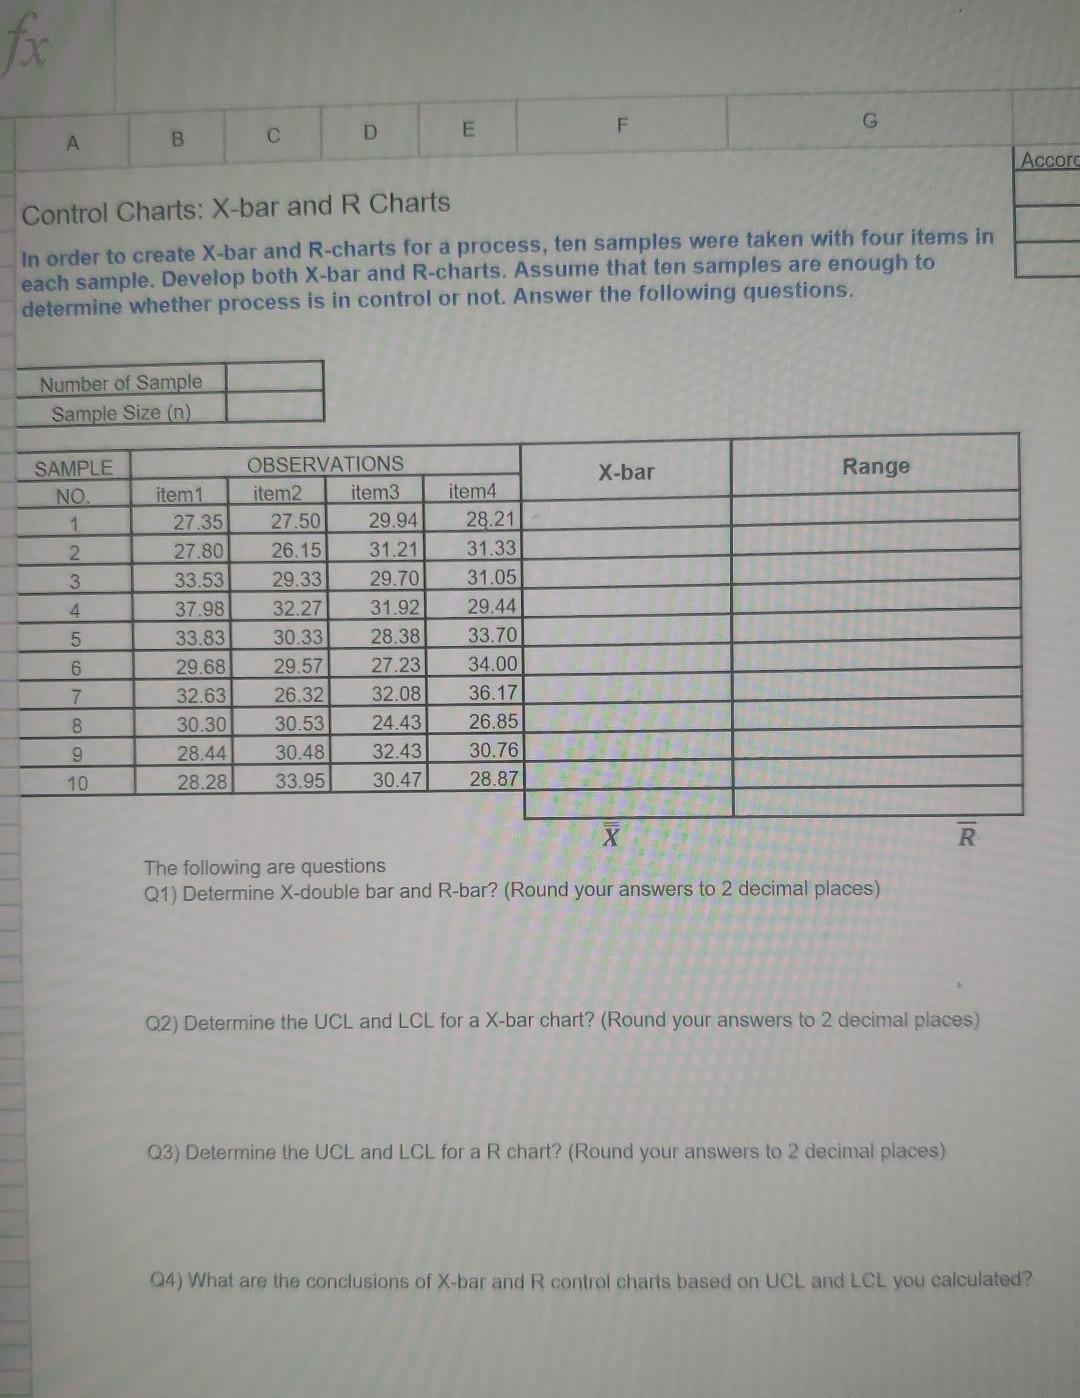
for G F D B A C E Accord Control Charts: X-bar and R Charts In order to create X-bar and R-charts for a process, ten samples were taken with four items in each sample. Develop both X-bar and R-charts. Assume that ten samples are enough to determine whether process is in control or not. Answer the following questions. Number of Sample Sample Size (n) X-bar Range SAMPLE . 1 2 3 4 OBSERVATIONS item2 item3 27.50 29.94 26.15 31.21 29.33 29.70 32.27 31.92 30.33 28.38 29.57 27.23 26.32 32.08 30.53 24.43 30.48 32.43 33.95 30.47 item1 27.35 27.80 33.53 37.98 33.83 29.68 32.63 30.30 28.44 28.28 5 item4 28.21 31.33 31.05 29.44 33.70 34.00 36.17 26.85 30.76 28.87 6 7 8. 9 10 R lic The following are questions Q1) Determine X-double bar and R-bar? (Round your answers to 2 decimal places) 02) Determine the UCL and LCL for a X-bar chart? (Round your answers to 2 decimal places) Q3) Determine the UCL and LCL for a R chart? (Round your answers to 2 decimal places) (4) What are the conclusions of X-bar and R control charts based on UCL and LCL you calculated
Step by Step Solution
There are 3 Steps involved in it
1 Expert Approved Answer
Step: 1 Unlock

Question Has Been Solved by an Expert!
Get step-by-step solutions from verified subject matter experts
Step: 2 Unlock
Step: 3 Unlock