

Question: The below graph contains a system curve and the performance curve for a single pump. Use this curve to: a) Sketch the resulting performance
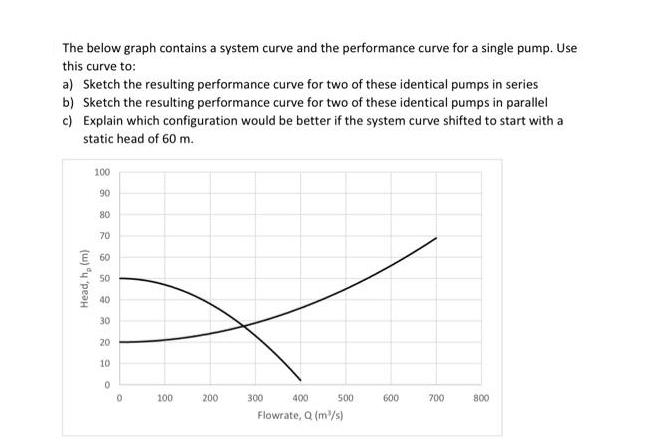
The below graph contains a system curve and the performance curve for a single pump. Use this curve to: a) Sketch the resulting performance curve for two of these identical pumps in series b) Sketch the resulting performance curve for two of these identical pumps in parallel c) Explain which configuration would be better if the system curve shifted to start with a static head of 60 m. Head, h, (m) 90 80 70 60 50 8228 229 100 30 20 10 0 100 200 300 400 500 600 700 800 Flowrate, Q (m/s)
Step by Step Solution
★★★★★
3.26 Rating (138 Votes )
There are 3 Steps involved in it
1 Expert Approved Answer
Step: 1 Unlock

Question Has Been Solved by an Expert!
Get step-by-step solutions from verified subject matter experts
Step: 2 Unlock
Step: 3 Unlock