

Question: For homework, I am to take this problem and try to figure out how to Draw a graph or figure to represent this situation. In
For homework, I am to take this problem and try to figure out how to Draw a graph or figure to represent this situation. In order to graph this, I first had to find the velocity, the position, and deceleration and then plug them all into the graph. Here is my work to show all of this.
Can someone double-check my work for me? Also, I don't think my graph is correct. Would you please show me how in demos graphing calculator or Geobra how I'm supposed to graph this correctly? Thank you
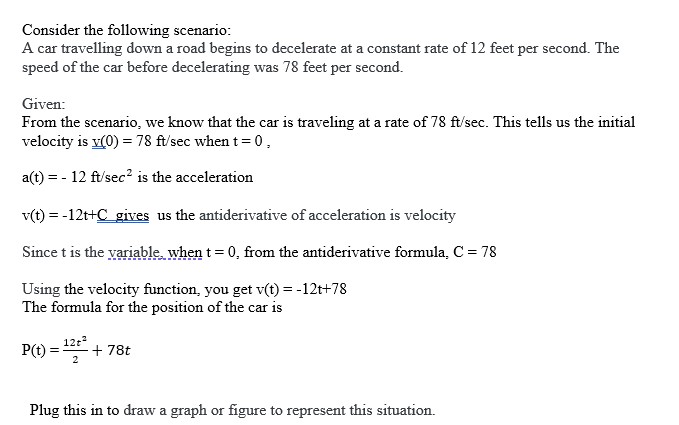
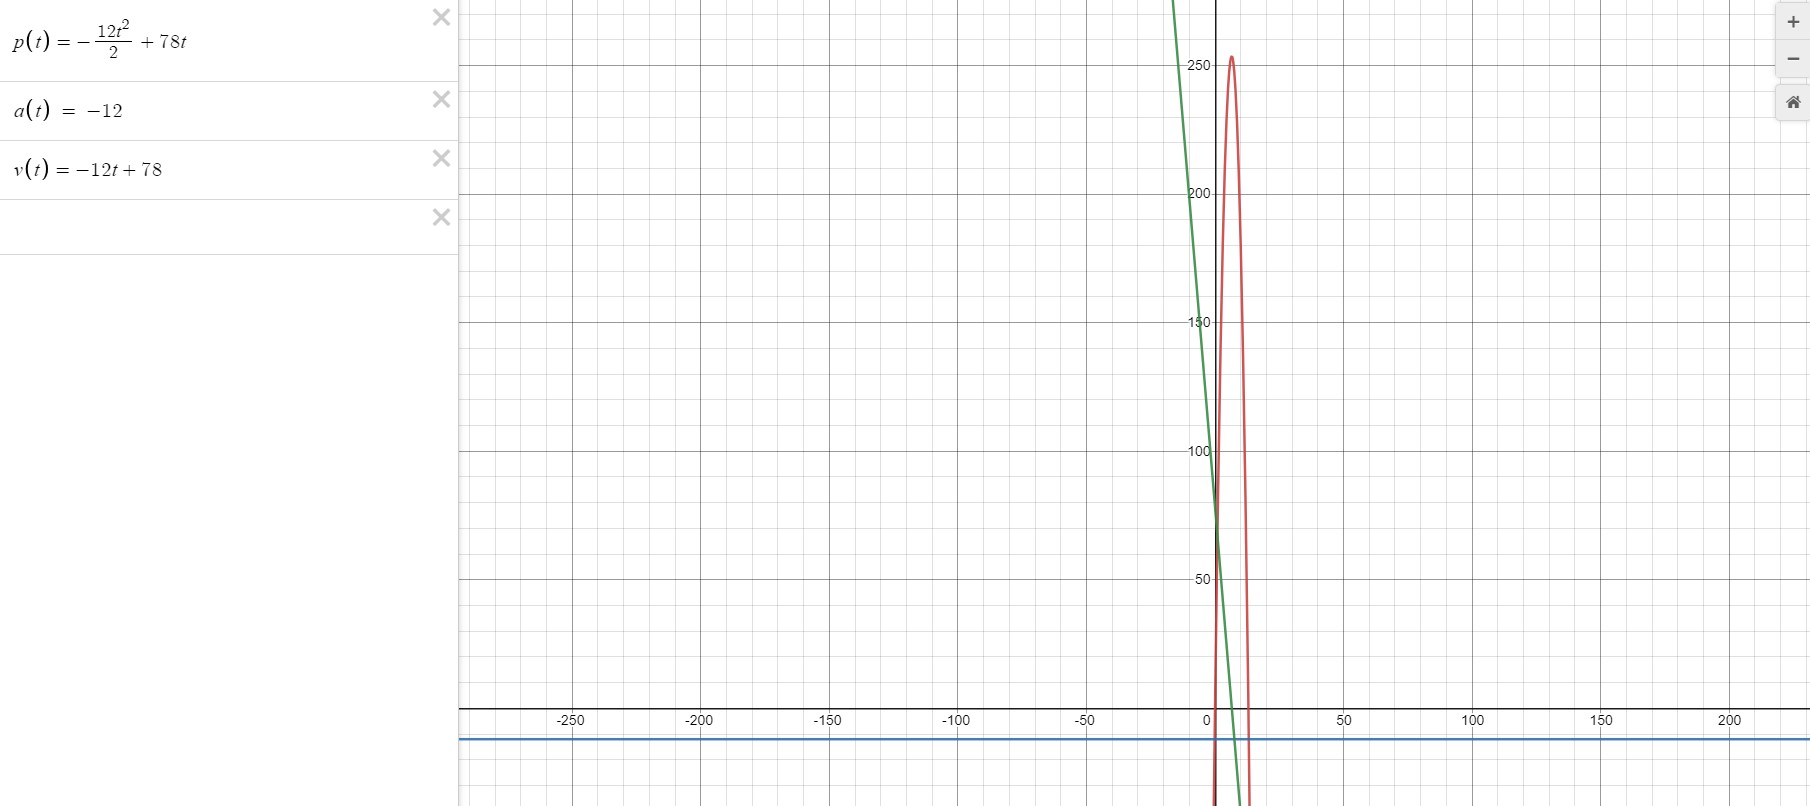
Consider the following scenario: A car travelling down a road begins to decelerate at a constant rate of 12 feet per second. The speed of the car before decelerating was 78 feet per second. Given: From the scenario, we know that the car is traveling at a rate of 78 ft/sec. This tells us the initial velocity is v(0) = 78 ft/sec when t = 0 , a(t) = - 12 ft/sec~ is the acceleration v(t) = -12t+C_gives us the antiderivative of acceleration is velocity Since t is the variable, when t = 0, from the antiderivative formula, C = 78 Using the velocity function, you get v(t) = -12t+78 The formula for the position of the car is P(t) =. 12+2 + 78t 2 Plug this in to draw a graph or figure to represent this situation.p(t) = _ 1212 X 2 + 78t + -250 a(t) = -12 X v(t) = -12t +78 X X POO 150- 100 50 -250 -200 150 -100 -50 0 50 100 150 200
Step by Step Solution
There are 3 Steps involved in it

Get step-by-step solutions from verified subject matter experts