

Question: For major league baseball teams, is there a relationship between player payrolls and gate money? Here are data for each of the National League
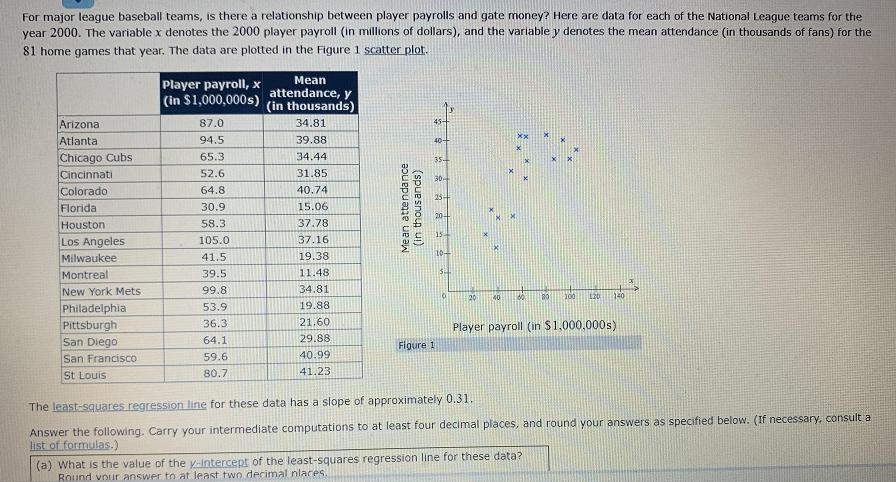
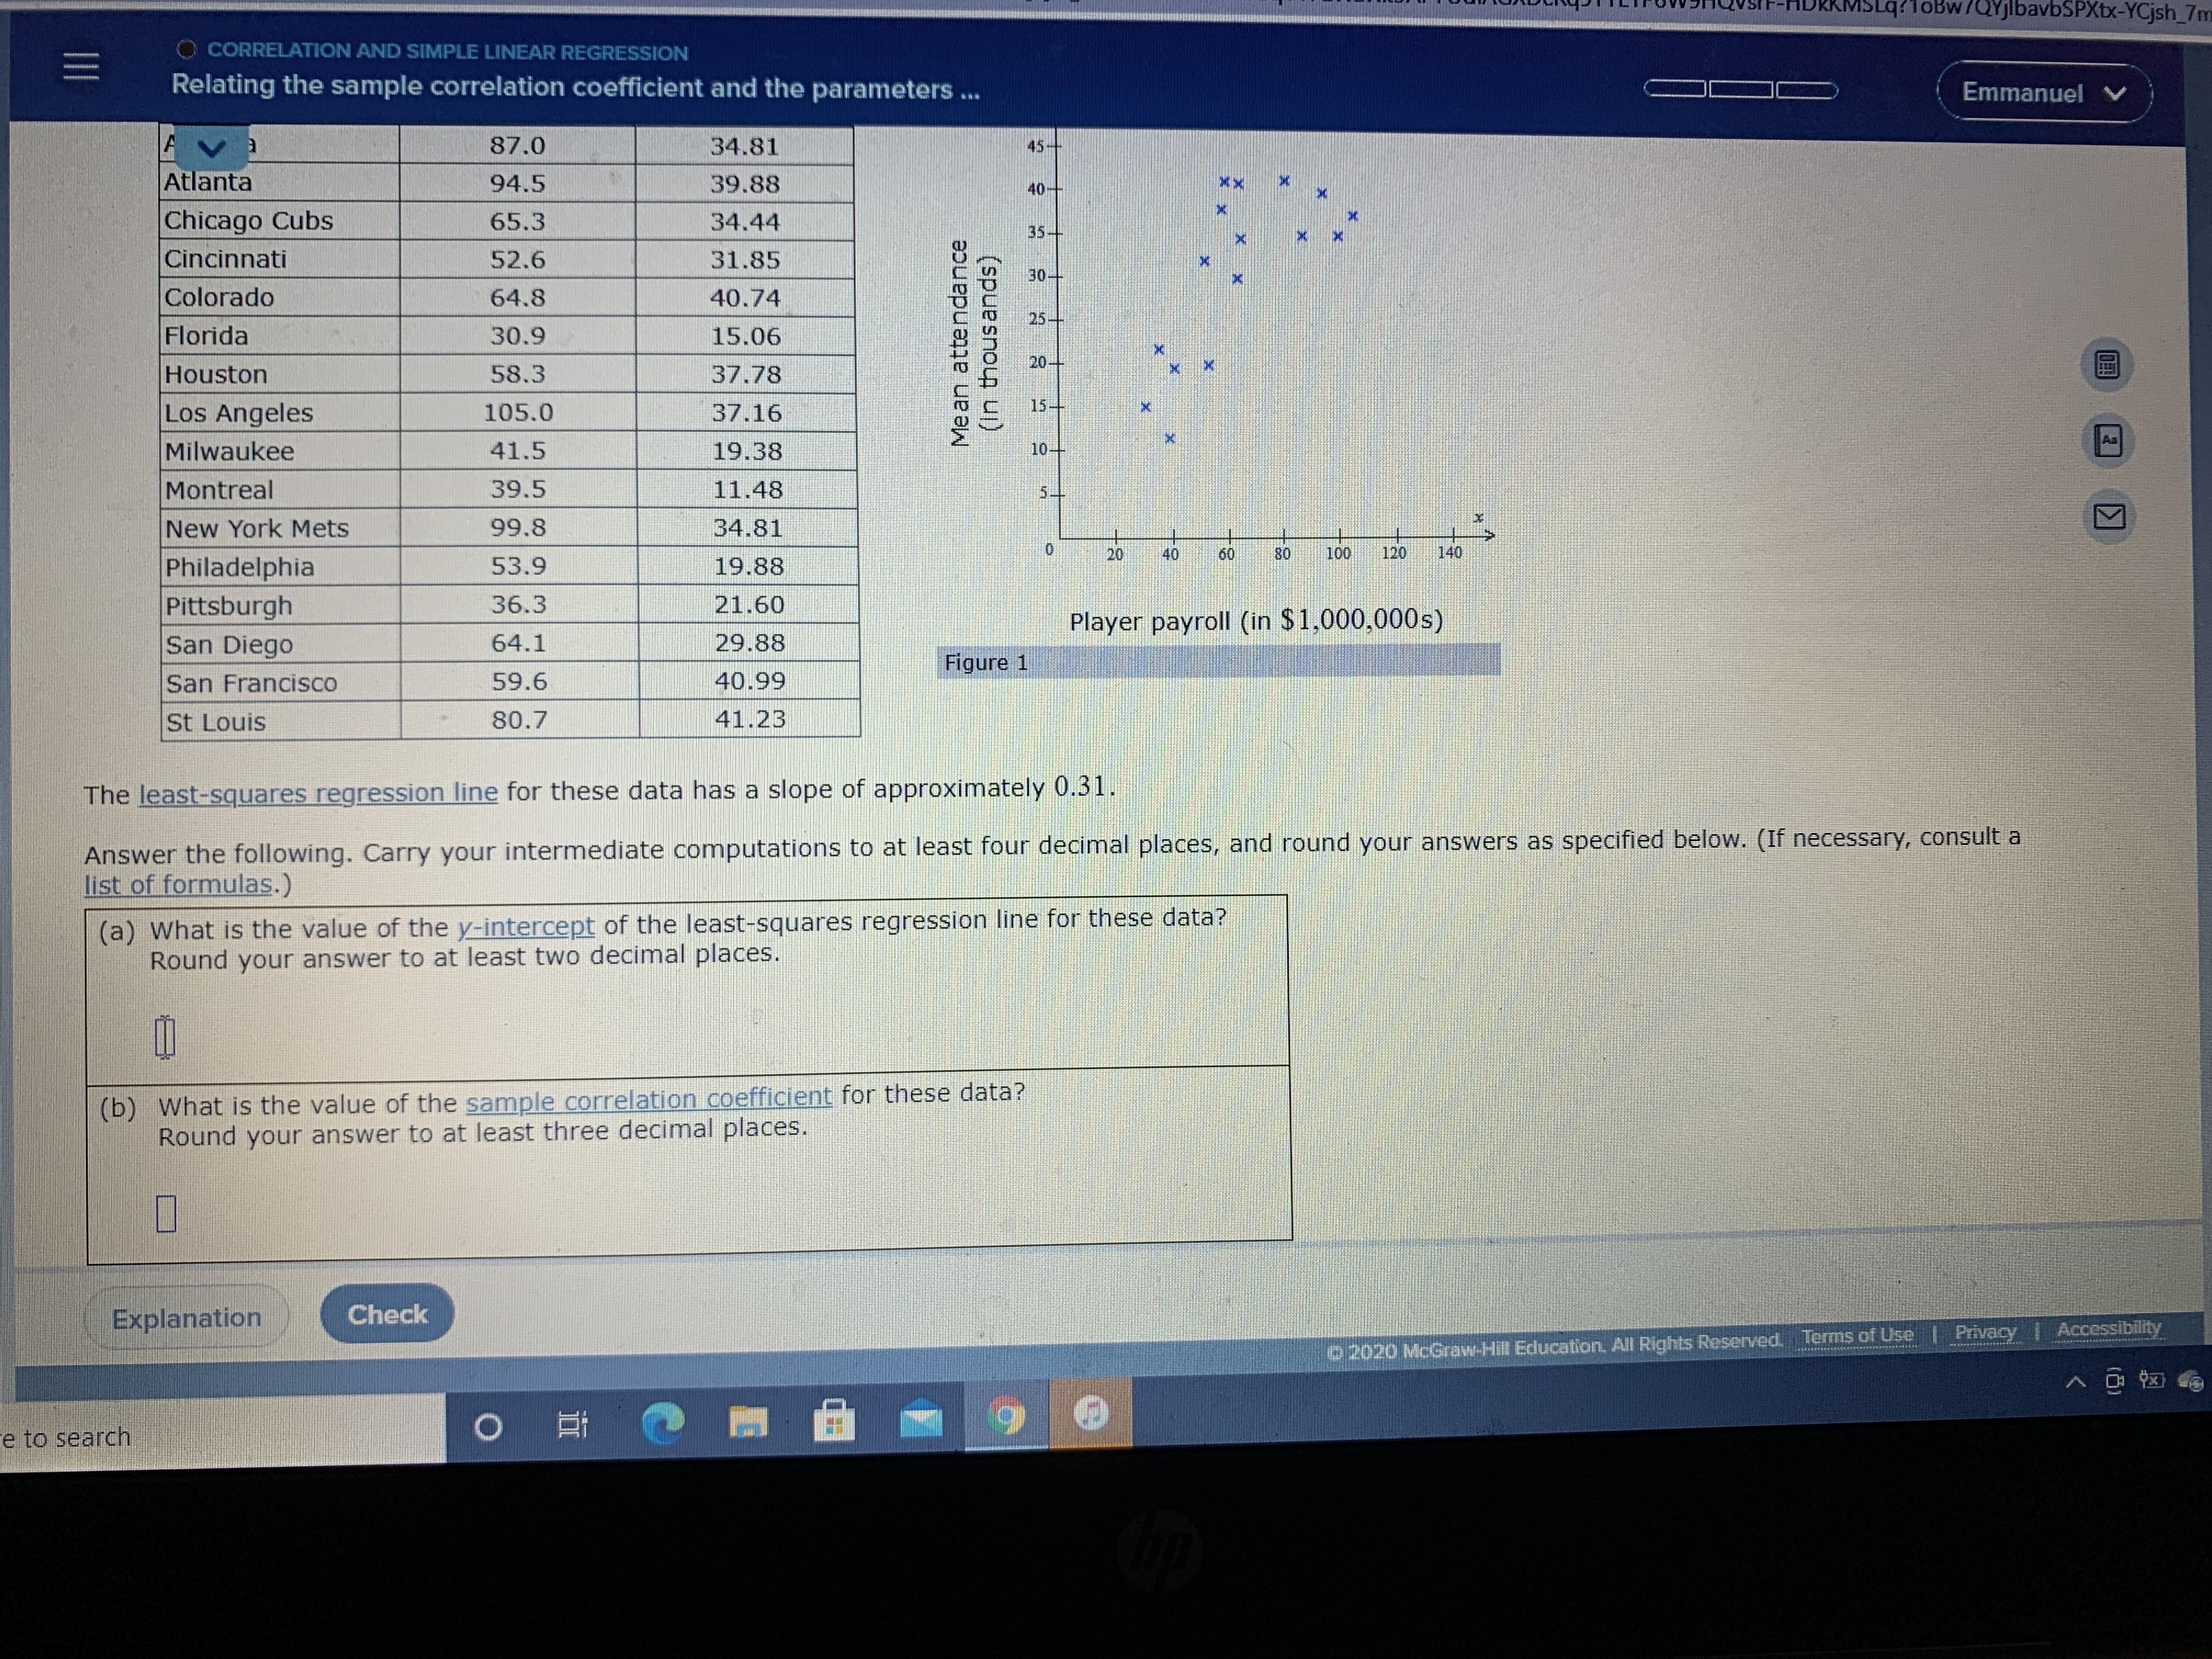
For major league baseball teams, is there a relationship between player payrolls and gate money? Here are data for each of the National League teams for the year 2000. The variable x denotes the 2000 player payroll (in millions of dollars), and the variable y denotes the mean attendance (in thousands of fans) for the 81 home games that year. The data are plotted in the Figure 1 scatter plot. Player payroll, x (in $1,000,000s) Mean attendance, y (in thousands) 45- Arizona Atlanta 87.0 34.81 94.5 39.88 40- Chicago Cubs Cincinnati Colorado Florida 65.3 34.44 35- 52.6 31.85 30 64.8 40.74 25+ 30.9 15.06 Houston 58.3 37.78 Los Angeles 105.0 37.16 Milwaukee 41.5 19.38 10- Montreal 39.5 11.48 34.81 New York Mets Philadelphia Pittsburgh San Diego San Francisco 99.8 20 100 140 53.9 19.88 36.3 21.60 Player payroll (in $1.000,000s) 64.1 29.88 Figure 1 59.6 40.99 St Louis 80.7 41.23 The least-squares regression line for these data has a slope of approximately 0.31. Answer the following. Carry your intermediate computations to at least four decimal places, and round your answers as specified below. (If necessary, consult a list of formulas.) (a) What is the value of the y-Intercept of the least-squares regression line for these data? Round vour answer to at least two decimal nlaces Mean attendance (spuesnoup ui) Lq?1oBw/QYjlbavbSPXbx-YCjsh_7m O CORRELATION AND SIMPLE LINEAR REGRESSION Relating the sample correlation coefficient and the parameters ... Emmanuel V A V 87.0 34.81 45+ Atlanta 94.5 39.88 40 Chicago Cubs 65.3 34.44 35+ Cincinnati 52.6 31.85 30 Colorado 64.8 40.74 25- Florida 30.9 15.06 204 Houston 58.3 37.78 Los Angeles 105.0 37.16 15- Milwaukee 41.5 19.38 10-- Montreal 39.5 11.48 New York Mets 99.8 34.81 20 40 60 80 100 120 140 Philadelphia Pittsburgh San Diego 53.9 19.88 36.3 21.60 Player payroll (in $1,000,000s) 64.1 29.88 Figure 1 San Francisco 59.6 40.99 St Louis 80.7 41.23 The least-squares regression line for these data has a slope of approximately 0.31. Answer the following. Carry your intermediate computations to at least four decimal places, and round your answers as specified below. (If necessary, consult a list of formulas.) (a) What is the value of the y-intercept of the least-squares regression line for these data? Round your answer to at least two decimal places. (b) What is the value of the sample correlation coefficient for these data? Round your answer to at least three decimal places. Explanation Check 2020 McGraw-Hill Education. All Rights Reserved. Terms of Use | Privacy Accessibility D o @ . e to search Me an attendance (In thous ands)
Step by Step Solution
3.49 Rating (149 Votes )
There are 3 Steps involved in it

Get step-by-step solutions from verified subject matter experts