

Question: . For making plots, you may use any technology. Good choices include Mathematica, Geogebra 30, CalcPlot3D, and Math3d.org. Label key items for your plots. You

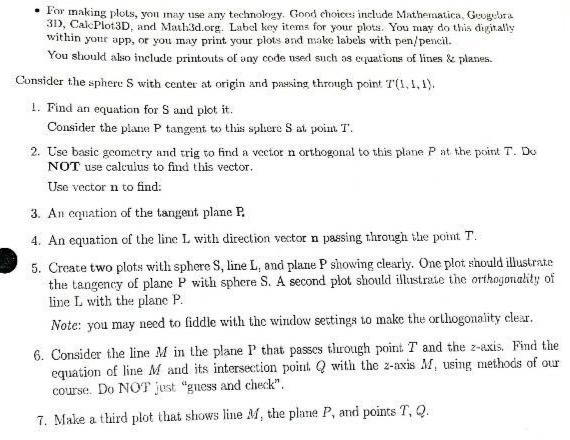
. For making plots, you may use any technology. Good choices include Mathematica, Geogebra 30, CalcPlot3D, and Math3d.org. Label key items for your plots. You may do this digitally within your app, or you may print your plots and make labels with pen/pencil. You should also include printouts of any code used such as equations of lines & planes. Consider the sphere S with center at origin and passing through point 7(1, 1, 1). 1. Find an equation for S and plot it. Consider the plane P tangent to this sphere S at point T. 2. Use basic geometry and trig to find a vector n orthogonal to this plane P at the point T. Do NOT use calculus to find this vector. Use vector n to find: 3. An equation of the tangent plane P. 4. An equation of the line L with direction vector n passing through the point T. 5. Create two plots with sphere S, line L, and plane P showing clearly. One plot should illustrate the tangency of plane P with sphere S. A second plot should illustrate the orthogonality of line L with the plane P. Note: you may need to fiddle with the window settings to make the orthogonality clear. 6. Consider the line M in the plane I that passes through point T and the z-axis. Find the equation of line M and its intersection point Q with the 2-axis M, using methods of our course. Do NOT just "guess and check". 7. Make a third plot that shows line M, the plane , and points T
Step by Step Solution
There are 3 Steps involved in it

Get step-by-step solutions from verified subject matter experts