

Question: For MATLAB 3. write a program to plot a scatter plot of data (x, y) pairs and compute the correlation coefficient. Data and details are
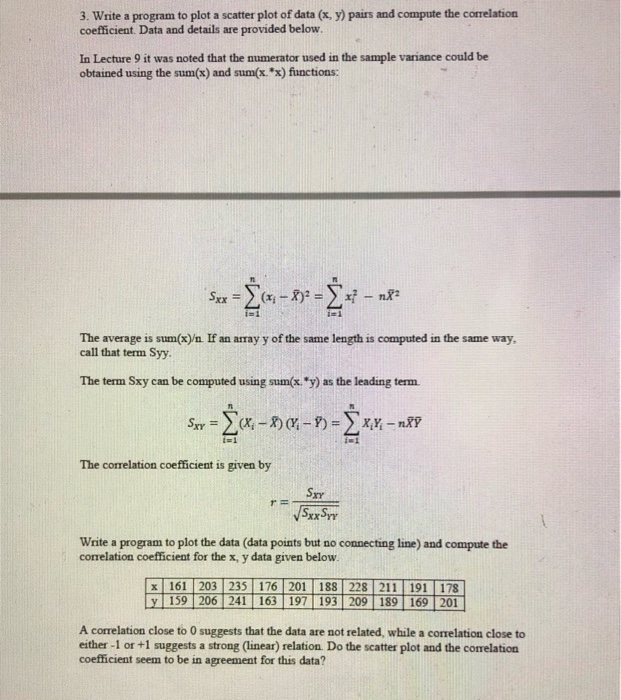
3. write a program to plot a scatter plot of data (x, y) pairs and compute the correlation coefficient. Data and details are provided below. In Lecture 9 it was noted that the numerator used in the sample variance could be obtained using the sum(x) and sum(x. 'x) functions: iz1 The average is sum(x). If an array y of the same length is computed in the same way call that term Syy. The term Sxy can be computed using sumx. "y) as the leading term The correlation coefficient is given by Sxr Write a program to plot the data (data points but no connecting line) and compute the comelation coefficient for the x, y data given below 188 y 159 206 241 163 197 193 209 189 169 201 A correlation close to 0 suggests that the data are not related, while a correlation close to either -1 or +1 suggests a strong (linear) relation Do the scatter plot and the correlation coefficient seem to be in agreement for this data
Step by Step Solution
There are 3 Steps involved in it

Get step-by-step solutions from verified subject matter experts