

Question: For Nike inc. Document a brief financial statement analysis over the company, including but not limited to the following: Commentary on the income statement, balance
For Nike inc. Document a brief financial statement analysis over the company, including but not limited to the following:
Commentary on the income statement, balance sheet, statement of cash flows
Trend analysis comparing current year performance to recent past years performance
You should have liquidity and efficiency 10 ratios
1. Current Ratio
2. Accid-Test Ratio
3. Accounts Receivable Turnover
4. Total Asset Turnover
Then move into Solvency ratios
1. Debt Ratio
2. Equity Ratio
3. Debt-to-Equity Ratio
Then you lastly Profitability
1. Profit Margin Ratio
2. Gross Margin Ratio
3. Return on Total Assets
After the ratios, you can look at the different statements and provide trend analysis.
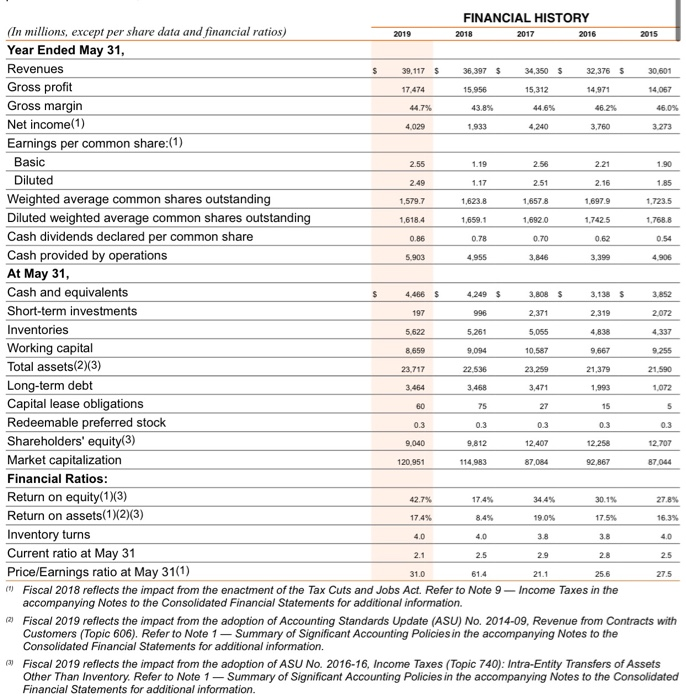

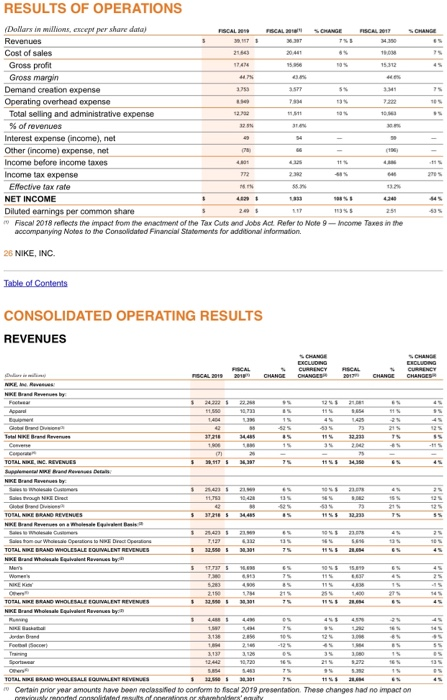
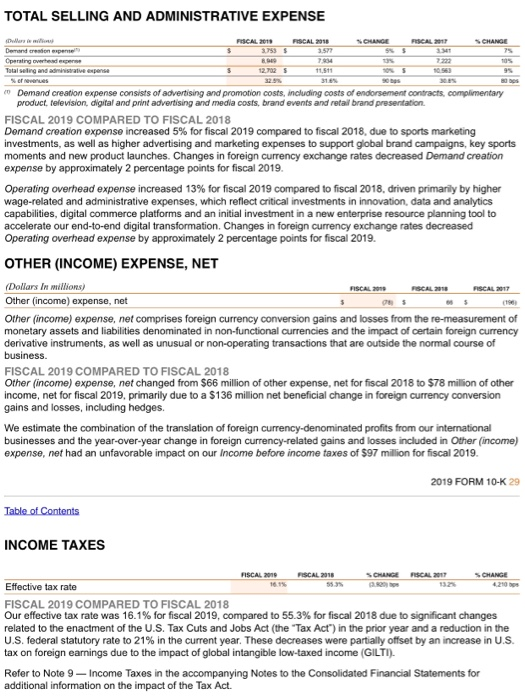
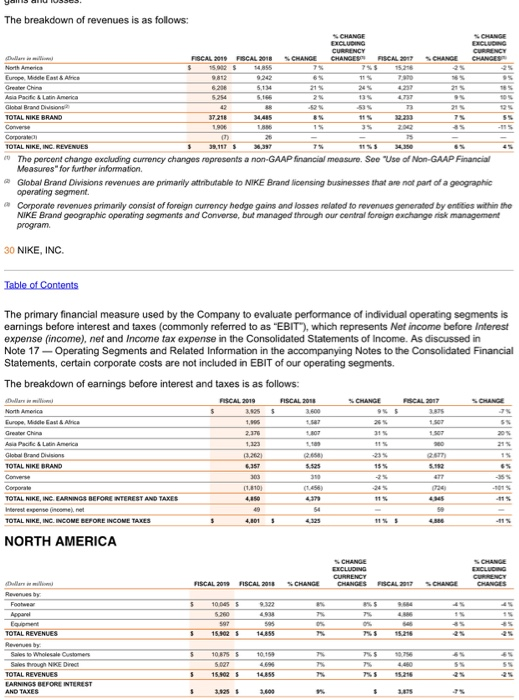
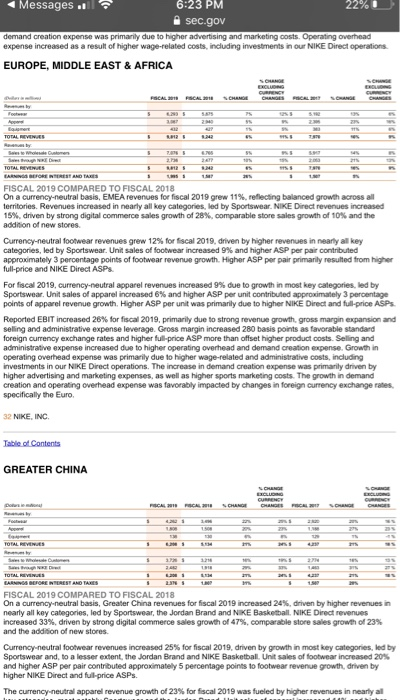
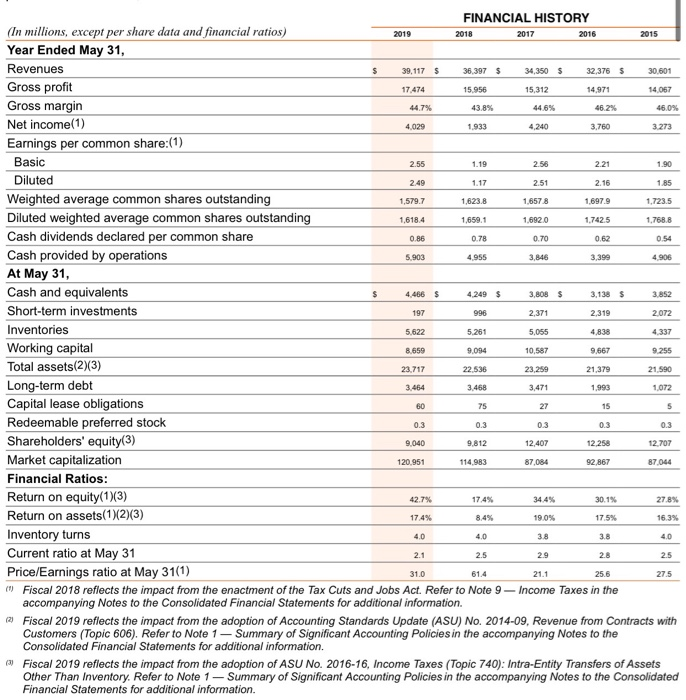
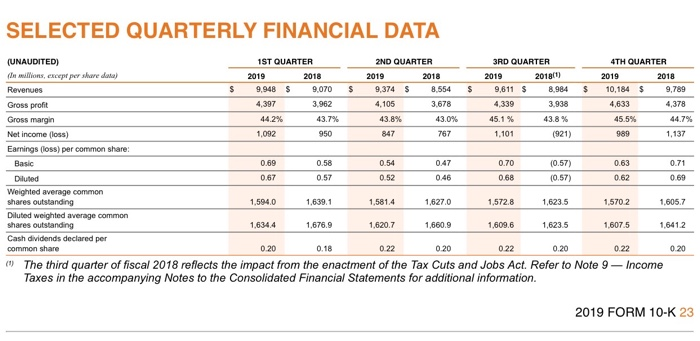
1.90 197 FINANCIAL HISTORY (In millions, except per share data and financial ratios) 2019 2018 2017 2016 2015 Year Ended May 31, Revenues 39,117 S 36,397 $ 34,350 $ 32,376 5 30,601 Gross profit 17.474 15.956 15,312 14,971 14.067 Gross margin 44.7% 43.8% 44,6% 46.2% 46.0% Net income(1) 4,029 1.933 4,240 3760 3.273 Earnings per common share:(1) Basic 2.55 1.19 2.56 2.21 Diluted 2.49 1.17 2. 51 2 .16 1.85 Weighted average common shares outstanding 1.579.7 1.623.8 1.6578 1.6979 1,723.5 Diluted weighted average common shares outstanding 1,6184 1,659.1 1,6920 1,742.5 1,758.8 Cash dividends declared per common share 0.86 0.78 0.70 0.62 054 Cash provided by operations 5.903 4.955 3,846 3,399 4.906 At May 31, Cash and equivalents 4.466 $ 4.249 $ 3.808 $ 3.138 $ 3852 Short-term investments 996 2,371 2,319 2072 Inventories 5,622 5.261 5 ,055 4838 4.337 Working capital 8.659 9.094 10,587 9,667 9255 Total assets(2(3) 23.717 22 536 23,259 21.379 21.590 Long-term debt 3.464 3.468 3,471 1,993 1,072 Capital lease obligations 60 - 27 15 Redeemable preferred stock 0.3 0.3 0.3 0.3 Shareholders' equity(3) 9.040 9.812 12,407 12258 12.707 Market capitalization 120 951 114.983 87 084 92.867 Financial Ratios: Return on equity(1)(3) 42.7% 17.4% 34.4% 30.1% 27.8% Return on assets(1)(2)(3) 17.4% 8.4% 19.0% 17.5% 16.3% Inventory turns 4.0 Current ratio at May 31 2.1 2.5 2.9 2.8 2.5 Price/Earnings ratio at May 31(1) 21.1 25.6 27.5 19 Fiscal 2018 reflects the impact from the enactment of the Tax Cuts and Jobs Act. Refer to Note 9-Income Taxes in the accompanying Notes to the Consolidated Financial Statements for additional information 2) Fiscal 2019 reflects the impact from the adoption of Accounting Standards Update (ASU) No. 2014-09, Revenue from Contracts with Customers (Topic 606). Refer to Note 1 - Summary of Significant Accounting Policies in the accompanying Notes to the Consolidated Financial Statements for additional information Fiscal 2019 reflects the impact from the adoption of ASU No. 2016-16, Income Taxes (Topic 740): Intra-Entity Transfers of Assets Other Than Inventory. Refer to Note 1 - Summary of Significant Accounting Policies in the accompanying Notes to the Consolidated Financial Statements for additional information. 75 SELECTED QUARTERLY FINANCIAL DATA 0.69 0.47 (UNAUDITED) 1ST QUARTER 2ND QUARTER 3RD QUARTER 4TH QUARTER (In millions, except per share data) 2019 2018 2019 2018 2019 2018 2019 2018 Revenues $ 9,948 $ 9,070 $ 9,374 $ 8,554 $ 9,611 $ 8,984 $ 10,184 $ 9,789 Gross profit 4,397 3.962 4 ,105 3.678 4,339 3 ,938 4,633 4,378 Gross margin 44.2% 43.7% 43.8% 43.0% 45.1% 43.8% 45.5% 44.7% Net income foss) 1.092 950 847 767 1,101 (921) 989 1,137 Earnings (los) per common share: Basic 0.58 0.54 0.70 (0.57) 0.63 0.71 Diluted 0.67 0.57 0.52 0.46 0.68 (0.57) 0.62 Weighted average common shares outstanding 1.594,0 1.639,1 1.581.4 1.6270 1.5728 1,623.5 1.5702 1.605.7 Diluted weighted average common shares outstanding 1.6344 1,676.9 1.620.7 1,660.9 16096 1,623.5 1.607.5 1.641.2 Cash dividends declared per common share 0.20 0.18 0.22 0.20 0.22 0.22 0.20 1 The third quarter of fiscal 2018 reflects the impact from the enactment of the Tax Cuts and Jobs Act. Refer to Note 9-Income Taxes in the accompanying Notes to the Consolidated Financial Statements for additional information. 0.69 0.20 2019 FORM 10-K 23 RESULTS OF OPERATIONS Dollars in mi s ure data Revenues Cost of sales Gross profit Gross margin Demand creation expense Operating overhead expense Total selling and administrative exp of revenues Interest expense (income.net Other (income) expense.net Income before income taxes Income tax expense Efective tax rate NET INCOME Diluted earnings per common share Fiscal 2018 reflects the impact from the nam e of the Tax cuts and Jobs Ad Refer to Note accompanying Notes to the Consolidated Financial Statements for additional information n come Taxes in the 26 NIKE, INC Table of Contents CONSOLIDATED OPERATING RESULTS REVENUES LLLLL ES plaa lala ES LE BRAND WHILE EQUENTES Certain prior year amounts have been reclassified to conform to fiscal 2019 presentation. These changes had no impact on TOTAL SELLING AND ADMINISTRATIVE EXPENSE Demand creation expense consists of advertising and promotion costs, including costs of endorsement contracte complimentary product forevision digital and print advertising and media costs, brand events and real brand presentation FISCAL 2019 COMPARED TO FISCAL 2018 Demand creation expense increased 5% for fiscal 2019 compared to fiscal 2018, due to sports marketing investments, as well as higher advertising and marketing expenses to support global brand campaigns, key sports moments and new product launches. Changes in foreign currency exchange rates decreased Demand creation expense by approximately 2 percentage points for fiscal 2019 Operating overhead expense increased 13% for fiscal 2019 compared to fiscal 2018, driven primarily by higher wage-related and administrative expenses, which reflect critical investments in innovation, data and analytics capabilities, digital commerce platforms and an initial investment in a new enterprise resource planning tool to accelerate our end-to-end digital transformation. Changes in foreign currency exchange rates decreased Operating overhead expense by approximately 2 percentage points for fiscal 2019 OTHER (INCOME) EXPENSE, NET FISCAL FISCAL (Dollars in millions) Other (income) expense, net Other (income) expense, net comprises foreign currency conversion gains and losses from the re-measurement of monetary assets and liabilities denominated in non-functional currencies and the impact of certain foreign currency derivative instruments, as well as unusual or non-operating transactions that are outside the normal course of business FISCAL 2019 COMPARED TO FISCAL 2018 Other (income) expense, not changed from $66 million of other expense, net for fiscal 2018 to $78 million of other income, net for fiscal 2019, primarily due to a $136 million net beneficial change in foreign currency conversion gains and losses, including hedges. We estimate the combination of the translation of foreign currency-denominated profits from our international businesses and the year-over-year change in foreign currency-related gains and losses included in Other (income) expense, net had an unfavorable impact on our Income before income taxes of $97 million for fiscal 2019. 2019 FORM 10-K 29 Table of Contents INCOME TAXES SORANGE FISCAL Effective tax rate FISCAL 2019 COMPARED TO FISCAL 2018 Our effective tax rate was 16.1% for fiscal 2019, compared to 55.3% for fiscal 2018 due to significant changes related to the enactment of the U.S. Tax Cuts and Jobs Act (the Tax Act) in the prior year and a reduction in the U.S. federal statutory rate to 21% in the current year. These decreases were partially offset by an increase in U.S. tax on foreign earnings due to the impact of global intangible low-taxed income (GILTI). Refer to Note 9-Income Taxes in the accompanying Notes to the Consolidated Financial Statements for additional information on the impact of the Tax Act. The breakdown of revenues is as follows: CURRENCY TOTAL NIKEN REVENUES The percent change excluding currency changes represents a non-GAAP financial measure. See Use of Non-GAAP Financial Measures for further information Global Brand Divisions revenues are primarily attributable to NIKE Brand licensing businesses that are not part of a geographic operating segment Corporate revenues primarily consist of foreign currency hedge gains and losses related to revenues generated by entities within the NIKE Brand geographic operating segments and Converse, but managed through our central foreign exchange risk management program 30 NIKE, INC. Table of Contents The primary financial measure used by the Company to evaluate performance of individual operating segments is earnings before interest and taxes (commonly referred to as "EBIT), which represents Not income before interest expense (income), net and Income tax expense in the Consolidated Statements of income. As discussed in Note 17-Operating Segments and Related Information in the accompanying Notes to the Consolidated Financial Statements, certain corporate costs are not included in EBIT of our operating segments. The breakdown of earnings before interest and taxes is as follows: FISCAL 2019 FISCAL 2018 CHANGE FISCAL 2017 Eaul Arc Burea Grow China Global Brands TOTAL NIKE BRAND 1.1983 Corporate TOTAL NIKE, IN EARNINGS BEFORE INTEREST AND TAXES TOTAL NIE, INC. INCONE BEFORE INCOME TAXES NORTH AMERICA
Step by Step Solution
There are 3 Steps involved in it

Get step-by-step solutions from verified subject matter experts