

Question: For nuance communications, before it was acquired by microsoft, I need help with providing a projected five-year income and balance sheet for the target firm
For nuance communications, before it was acquired by microsoft, I need help with providing a projected five-year income and balance sheet for the target firm and one year consolidated for the acquirer and target firms. the acquirer is microsoft.
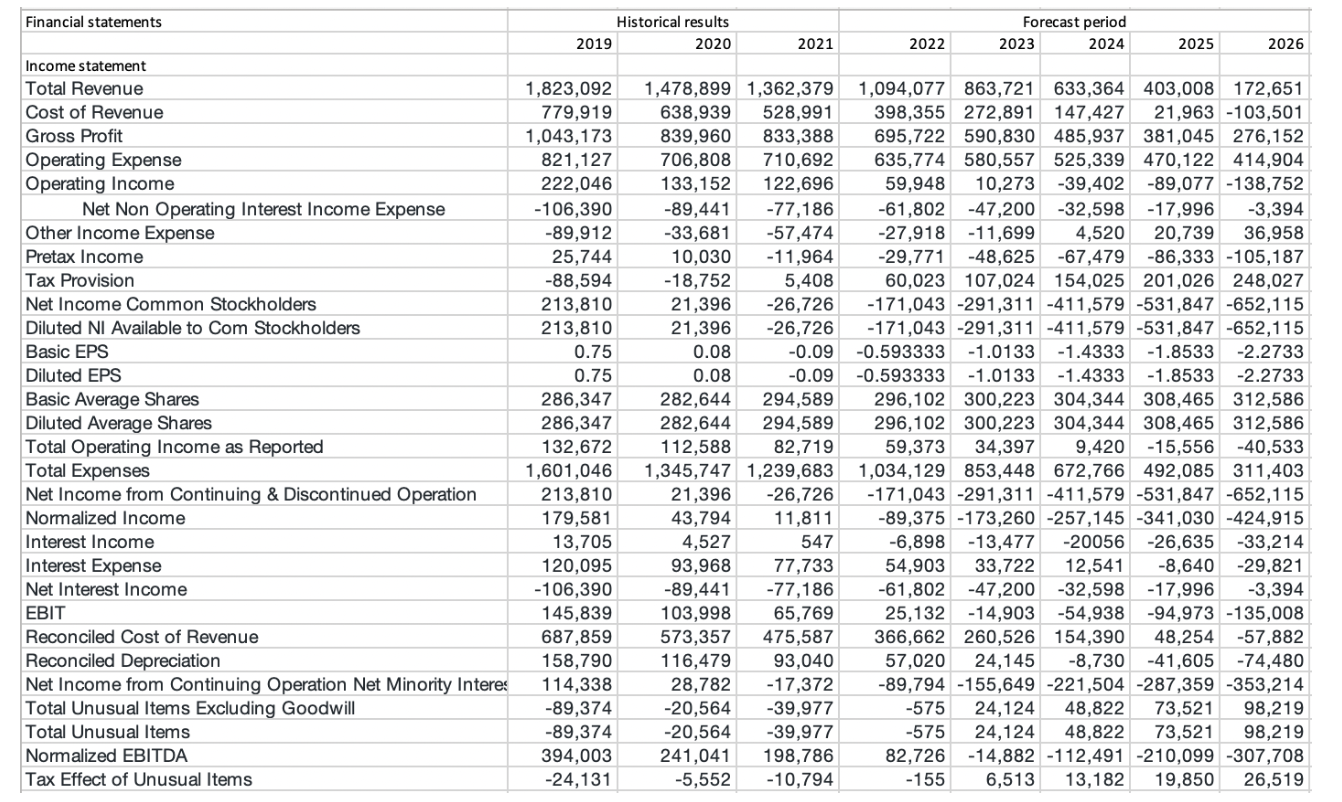
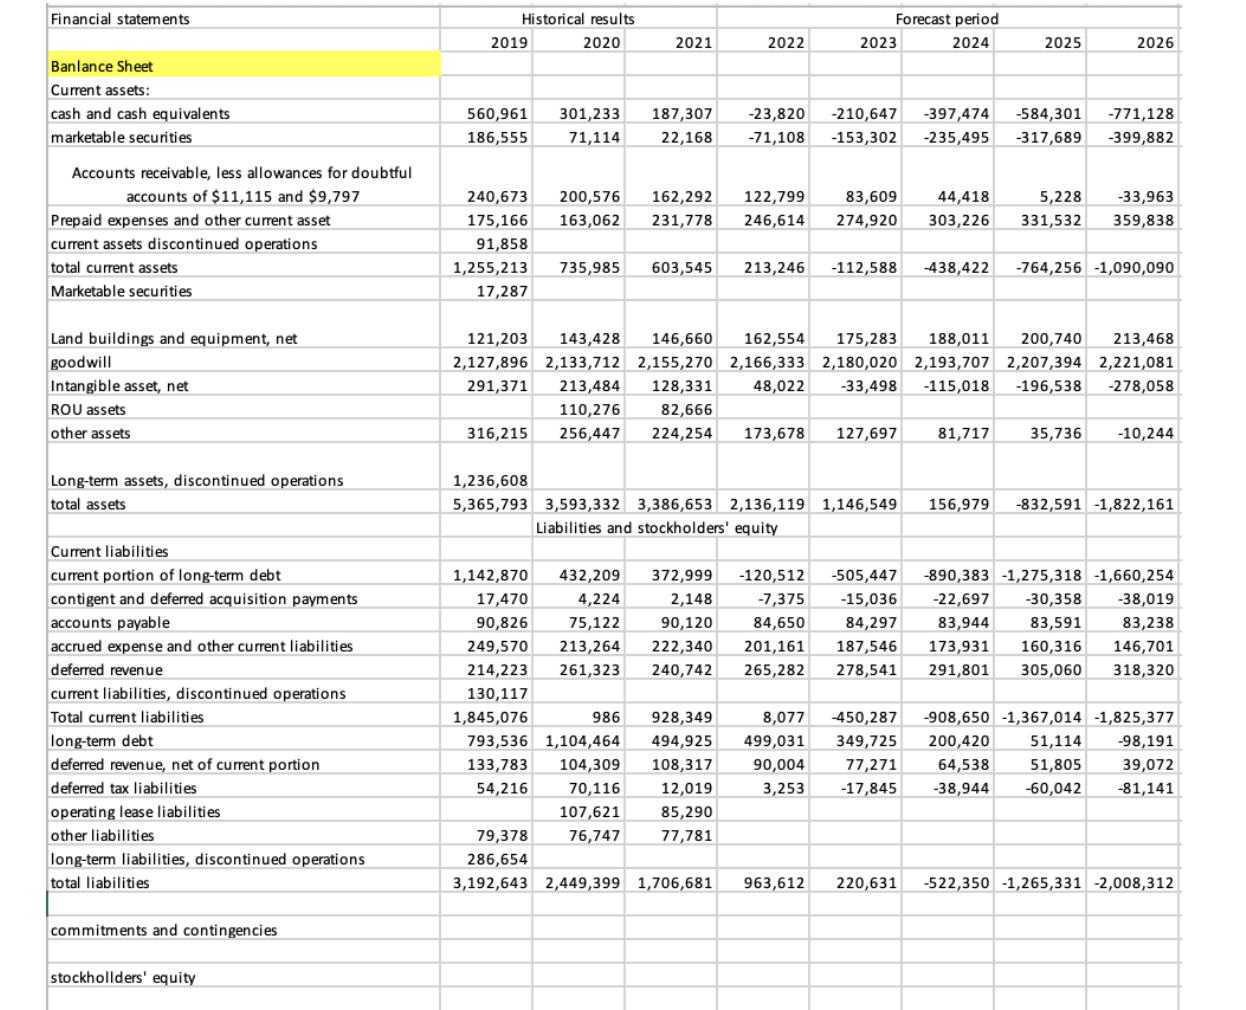
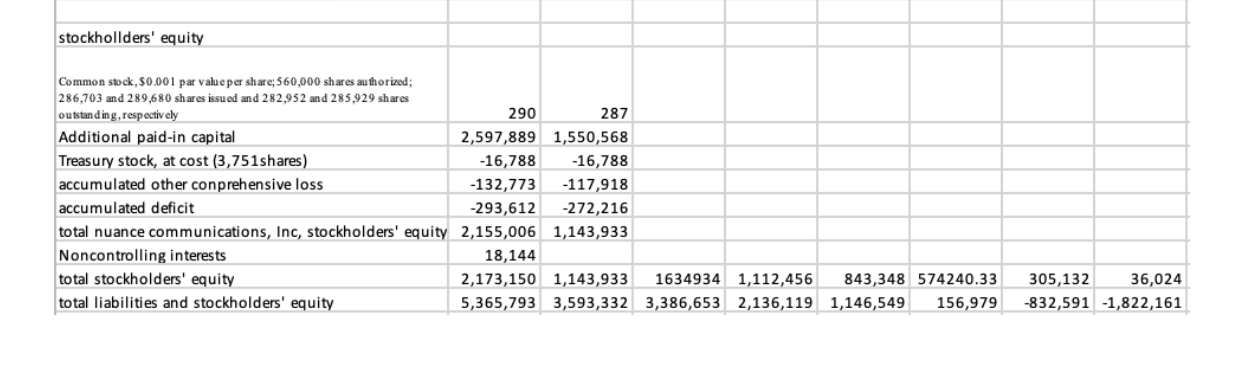
Financial statements Historical results Forecast period 2019 2020 2021 2022 2023 2024 2025 2026 Income statement Total Revenue 1,823,092 1,478,899 1,362,379 1,094,077 863,721 633,364 403,008 172,651 Cost of Revenue 779,919 638,939 528,991 398,355 272,891 147,427 21,963 -103,501 Gross Profit 1,043,173 839,960 833,388 695,722 590,830 485,937 381,045 276,152 Operating Expense 821,127 706,808 710,692 635,774 580,557 525,339 470,122 414,904 Operating Income 222,046 133,152 122,696 59,948 10,273 -39,402 -89,077 -138,752 Net Non Operating Interest Income Expense -106,390 -89,441 -77,186 -61,802 -47,200 -32,598 -17,996 -3,394 Other Income Expense -89,912 -33,681 -57,474 -27,918 -11,699 4,520 20,739 36,958 Pretax Income 25,744 10,030 -11,964 -29,771 -48,625 -67,479 -86,333 -105,187 Tax Provision -88,594 -18,752 5,408 60,023 107,024 154,025 201,026 248,027 Net Income Common Stockholders 213,810 21,396 -26,726 -171,043 -291,311 -411,579 -531,847 -652,115 Diluted NI Available to Com Stockholders 213,810 21,396 -26,726 -171,043 -291,311 -411,579 -531,847 -652,115 Basic EPS 0.75 0.08 -0.09 -0.593333 -1.0133 -1.4333 -1.8533 -2.2733 Diluted EPS 0.75 0.08 -0.09 -0.593333 -1.0133 -1.4333 -1.8533 -2.2733 Basic Average Shares 286,347 282,644 294,589 296,102 300,223 304,344 308,465 312,586 Diluted Average Shares 286,347 282,644 294,589 296,102 300,223 304,344 308,465 312,586 Total Operating Income as Reported 132,672 112,588 82,719 59,373 34,397 9,420 -15,556 -40,533 Total Expenses 1,601,046 1,345,747 1,239,683 1,034,129 853,448 672,766 492,085 311,403 Net Income from Continuing & Discontinued Operation 213,810 21,396 -26,726 -171,043 -291,311 -411,579 -531,847 -652,115 Normalized Income 179,581 43,794 11,811 -89,375 -173,260 -257,145 -341,030 -424,915 Interest Income 13,705 4,527 547 -6,898 -13,477 -20056 -26,635 -33,214 Interest Expense 120,095 93,968 77,733 54,903 33,722 12,541 -8,640 -29,821 Net Interest Income -106,390 -89,441 -77,186 -61,802 -47,200 -32,598 -17,996 -3,394 EBIT 145,839 103,998 65,769 25,132 -14,903 -54,938 -94,973 -135,008 Reconciled Cost of Revenue 687,859 573,357 475,587 366,662 260,526 154,390 48,254 -57,882 Reconciled Depreciation 158,790 116,479 93,040 57,020 24,145 -8,730 -41,605 -74,480 Net Income from Continuing Operation Net Minority Interes 114,338 28,782 -17,372 -89,794 -155,649 -221,504 -287,359 -353,214 Total Unusual Items Excluding Goodwill -89,374 -20,564 -39,977 -575 24,124 48,822 73,521 98,219 Total Unusual Items -89,374 -20,564 -39,977 -575 24,124 48,822 73,521 98,219 Normalized EBITDA 394,003 241,041 198,786 82,726 -14,882 -112,491 -210,099 -307,708 Tax Effect of Unusual Items -24,131 -5,552 -10,794 -155 6,513 13,182 19,850 26,519Financial statements Historical results Forecast period 2019 2020 2021 2022 2023 2024 2025 2026 Banlance Sheet Current assets: cash and cash equivalents 560,961 301,233 187,307 -23,820 -210,647 -397,474 -584,301 -771,128 marketable securities 186,555 71,114 22,168 -71,108 -153,302 -235,495 -317,689 -399,882 Accounts receivable, less allowances for doubtful accounts of $11,115 and $9,797 240,673 200,576 162,292 122,799 83,609 44,418 5,228 -33,963 Prepaid expenses and other current asset 175,166 163,062 231,778 246,614 274,920 303,226 331,532 359,838 current assets discontinued operations 91,858 total current assets 1,255,213 735,985 603,545 213,246 -112,588 -438,422 -764,256 -1,090,090 Marketable securities 17,287 Land buildings and equipment, net 121,203 143,428 146,660 162,554 175,283 188,011 200,740 213,468 goodwill 2,127,896 2,133,712 2,155,270 2,166,333 2,180,020 2,193,707 2,207,394 2,221,081 Intangible asset, net 291,371 213,484 128,331 48,022 -33,498 -115,018 -196,538 -278,058 ROU assets 110,276 82,666 other assets 316,215 256,447 224,254 173,678 127,697 81,717 35,736 -10,244 Long-term assets, discontinued operations 1,236,608 total assets 5,365,793 3,593,332 3,386,653 2,136,119 1,146,549 156,979 -832,591 -1,822,161 Liabilities and stockholders' equity Current liabilities current portion of long-term debt 1,142,870 432,209 372,999 -120,512 -505,447 -890,383 -1,275,318 -1,660,254 contigent and deferred acquisition payments 17,470 4,224 2,148 -7,375 -15,036 -22,697 -30,358 -38,019 accounts payable 90,826 75,122 90,120 84,650 84,297 83,944 83,591 83,238 accrued expense and other current liabilities 249,570 213,264 222,340 201,161 187,546 173,931 160,316 146,701 deferred revenue 214,223 261,323 240,742 265,282 278,541 291,801 305,060 318,320 current liabilities, discontinued operations 130,117 Total current liabilities 1,845,076 986 928,349 8,077 -450,287 -908,650 -1,367,014 -1,825,377 long-term debt 793,536 1,104,464 494,925 499,031 349,725 200,420 51,114 -98,191 deferred revenue, net of current portion 133,783 104,309 108,317 90,004 77,271 64,538 51,805 39,072 deferred tax liabilities 54,216 70,116 12,019 3,253 -17,845 -38,944 -60,042 -81,141 operating lease liabilities 107,621 85,290 other liabilities 79,378 76,747 77,781 long-term liabilities, discontinued operations 286,654 total liabilities 3,192,643 2,449,399 1,706,681 963,612 220,631 -522,350 -1,265,331 -2,008,312 commitments and contingencies stockhollders' equitystockhollders' equity Common stock, $0.001 par value per share; 560,000 shares authorized; 286,703 and 289,680 shares issued and 282,952 and 285,929 shares outstanding, respectively 290 287 Additional paid-in capital 2,597,889 1,550,568 Treasury stock, at cost (3,751shares) -16,788 -16,788 accumulated other conprehensiless -132,773 -117,918 accumulated deficit -293,612 -272,216 total nuance communications, Inc, stockholders' equity 2,155,006 1,143,933 Noncontrolling interests 18,144 total stockholders' equity 2,173,150 1,143,933 1634934 1,112,456 843,348 574240.33 305,132 36,024 total liabilities and stockholders' equity 5,365,793 3,593,332 3,386,653 2,136,119 1,146,549 156,979 -832,591 -1,822,161
Step by Step Solution
There are 3 Steps involved in it

Get step-by-step solutions from verified subject matter experts