

Question: For Oppo, load all the column data for the different periods into python. Do not input the data manually. Based on the column data, draw
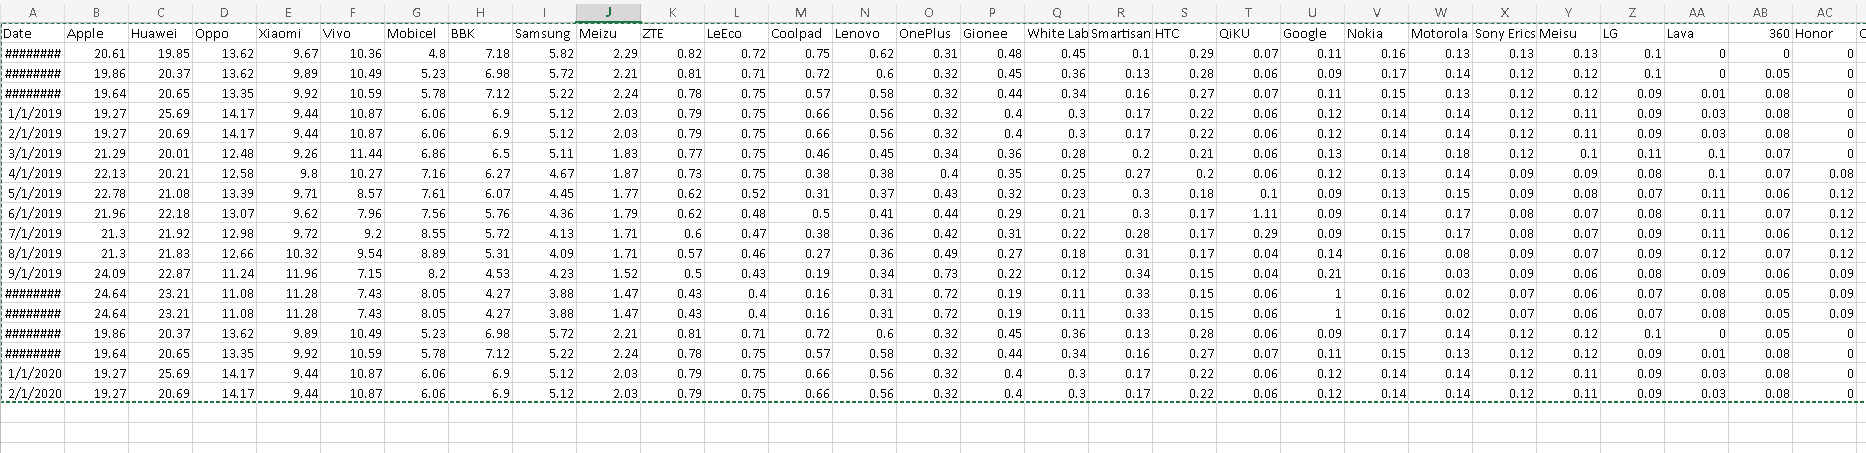
For Oppo, load all the column data for the different periods into python. Do not input the data manually. Based on the column data, draw a bar chart with green color. Use Date as xaxis and market share as Yaxis. Make a title of "Oppo Market Share" to the plot. Code absolutely has to be in python and the data must come from the file dvsample which I have attached a screenshot of Thank you in advance!
Step by Step Solution
There are 3 Steps involved in it
1 Expert Approved Answer
Step: 1 Unlock

Question Has Been Solved by an Expert!
Get step-by-step solutions from verified subject matter experts
Step: 2 Unlock
Step: 3 Unlock