

Question: For our lab we must find a model for the concentration of tea relating to temperature. Can you help me find a differential equation to
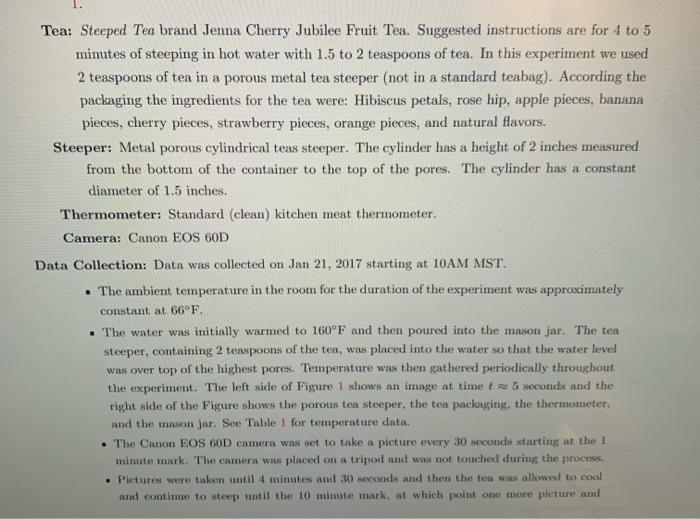
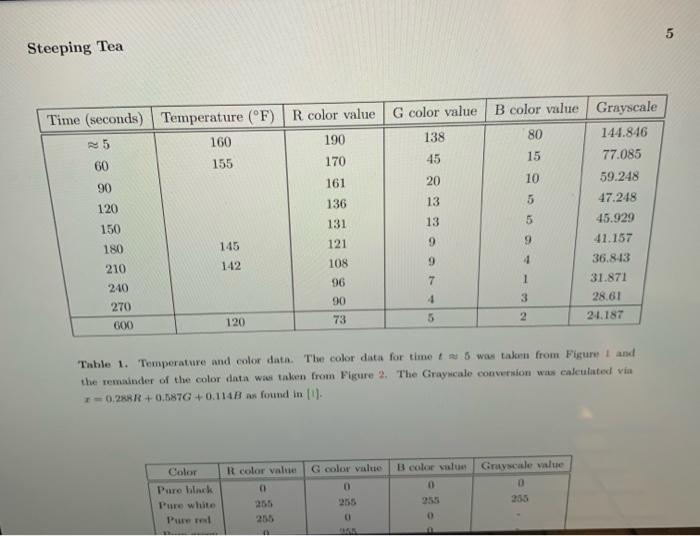
1. Use the color data (Table 1) (shown pictorially in Figure 2) to develop, analyze, and solve a differential equation model for the concentration of the tea. In this case, color is being used as a proxy measure for the concentration of the dissolved tea oils since we can reasonably expect that the color of the tea is related to the concentration of the tea oil in the solution (pause for a minute and think about how they might be mathematically related). In Table 1 we give the Red (R), Green (G), Blue (B), and Grayscale color values (calculated using the formula x=0.288R+0.587G+0.114B as found in (1]) for pixels in the photographs of the tea. In Table 2 we give the meaning of all of the color values. These meanings are common across photography software. 2. Use the small set of sugar cube data in Table 3 to develop, analyze, and solve a differential equation model for the dissolution of a 1cm3 sugar cube in the tea. Determine the amount of time that it takes to dissolve the sugar cube. Include a plot of the time evolution of the sugar dissolution and be sure that your data points are visible on the plot. 3. Use the temperature data in Table 1 to develop, analyze, and solve a differential equation model for the temperature of the tea during the time that it takes to steep. Include a plot of the time evolution of the temperature and be sure that your data points are visible on the plot. 4. It should be clear from your experience with warm liquids that the temperature should play a role in the concentration model. Propose and solve a coupled model for temperature and Steeping Tea concentration. The easiest way to do this is probably to assume that the constants in the concentration model are actually functions of temperature. 5. Write a clear paper to a technically sophisticated audience giving the details of your differential equation modeling tasks and your rorults. Be sure to state and defend all of your assumptions in clear language. If you do not use differential equation models for each of the four main parts of the problem you will receive a " 0" on the lab. This is not an exercise in guessing functions and. fittinc eurves aleabruicalls. Tea: Steeped Tea brand Jenna Cherry Jubilee Fruit Tea. Suggested instructions are for 4 to 5 minutes of steeping in hot water with 1.5 to 2 teaspoons of tea. In this experiment we used 2 teaspoons of tea in a porous metal tea steeper (not in a standard teabag). According the packaging the ingredients for the tea were: Hibiscus petals, rose hip, apple pieces, banana pieces, cherry pieces, strawberry pieces, orange pieces, and natural flavors. Steeper: Metal porous cylindrical teas steeper. The cylinder has a height of 2 inches measured from the bottom of the container to the top of the pores. The cylinder has a constant diameter of 1.5 inches. Thermometer: Standard (clean) kitchen meat thermometer. Camera: Canon EOS 60D Data Collection: Data was collected on Jan 21, 2017 starting at 10AM MST. - The ambient temperature in the room for the duration of the experiment was approximately constant at 66F, - The water was initially warmed to 160F and then poured into the mason jar. The tea steeper, containing 2 teaspoons of the tea, was placed into the water so that the water level was over top of the highest pores. Temperature was then gathered periodically throughout the experiment. The left side of Figure 1 shows an image at time t5 seconds and the right side of the Figure shows the porous ten steeper, the tea packaging, the thermometen, and the mason jar. See Table 1 for temperature data. - The Canon EOS 60D camera was set to take a picture every 30 seconds starting at the 1 minute mark. The camera was placed on a tripod and was not touched during the process, - Pictures were taken until 4 minutes and 30 seconds and then the tea was allowed to cool and contimue to stesp until the 10 minute mark, at which point ane more pleture and Steeping Tea Table 1. Temperature and color data. The color data for time t5 was takern from Figure t and the remainder of the color data was taken from Figure 2. The Graysicale conversion was calculated via x=0.288R+0.587G+0.114B an found in (1)
Step by Step Solution
There are 3 Steps involved in it

Get step-by-step solutions from verified subject matter experts