Question: FOR PART A AND B PLEASE USE EXCEL RATHER THAN THE TABLE AS STATED IN THE QUESTION Fashionables is a franchisee of The Unlimited, the
FOR PART A AND B PLEASE USE EXCEL RATHER THAN THE TABLE AS STATED IN THE QUESTION
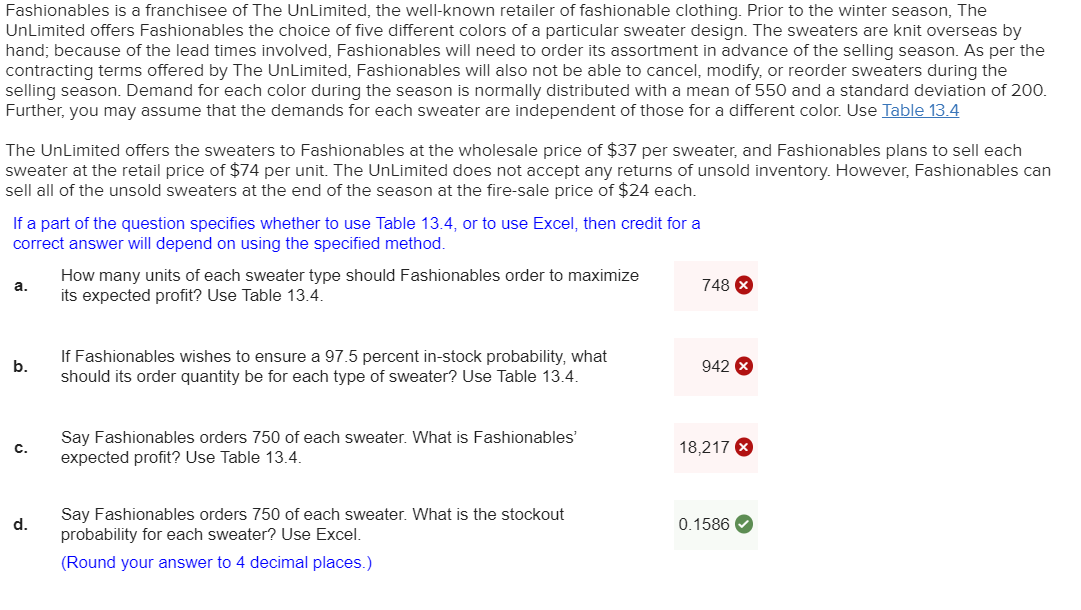
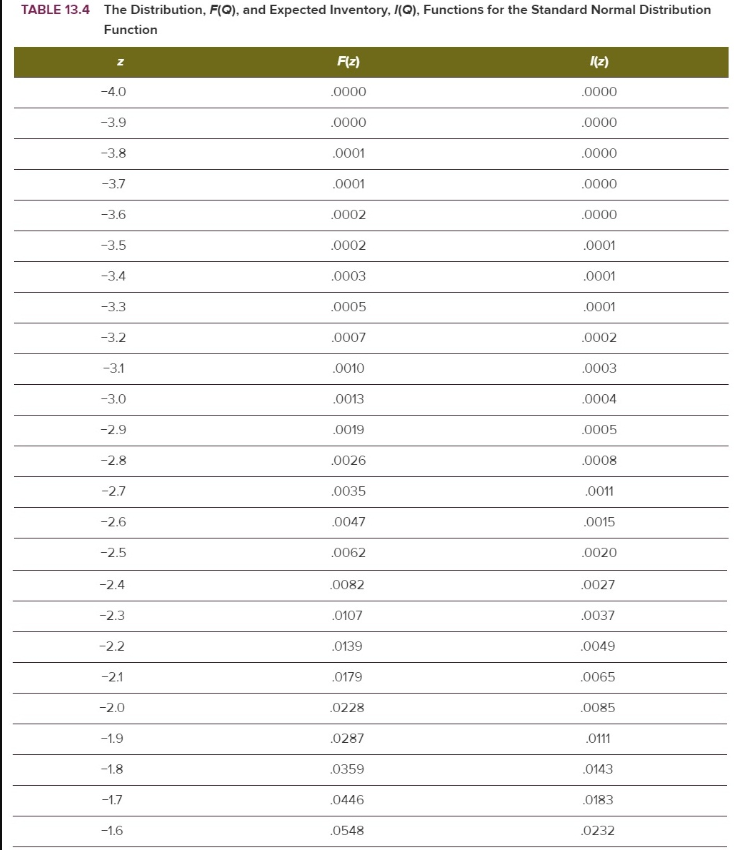
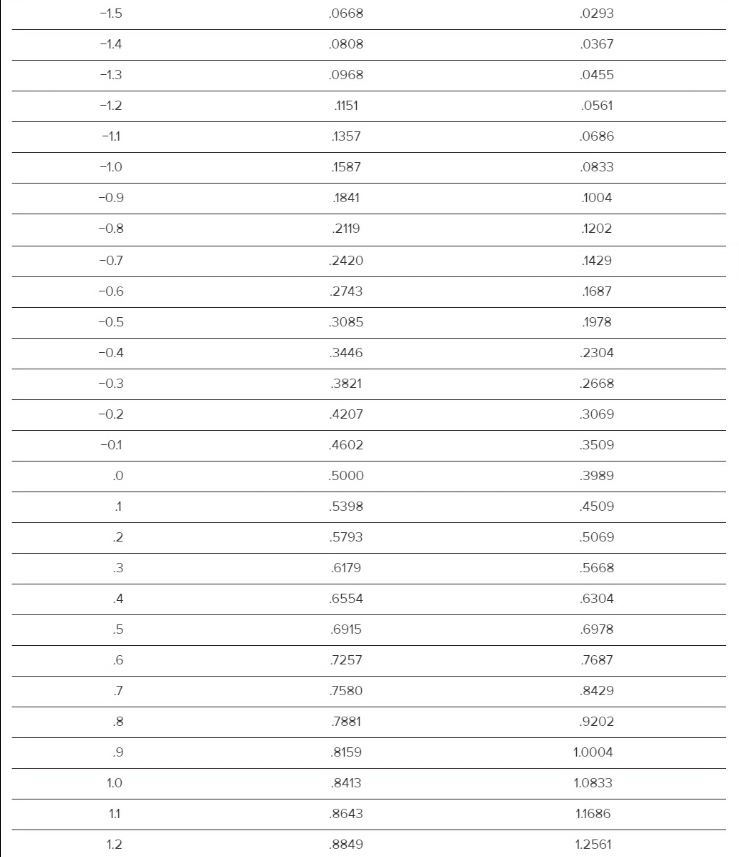
Fashionables is a franchisee of The Unlimited, the well-known retailer of fashionable clothing. Prior to the winter season, The Unlimited offers Fashionables the choice of five different colors of a particular sweater design. The sweaters are knit overseas by hand, because of the lead times involved, Fashionables will need to order its assortment in advance of the selling season. As per the contracting terms offered by The Unlimited, Fashionables will also not be able to cancel, modify, or reorder sweaters during the selling season. Demand for each color during the season is normally distributed with a mean of 550 and a standard deviation of 200. Further, you may assume that the demands for each sweater are independent of those for a different color. Use Table 13.4 The Unlimited offers the sweaters to Fashionables at the wholesale price of $37 per sweater, and Fashionables plans to sell each sweater at the retail price of $74 per unit. The Unlimited does not accept any returns of unsold inventory. However, Fashionables can sell all of the unsold sweaters at the end of the season at the fire-sale price of $24 each. If a part of the question specifies whether to use Table 13.4, or to use Excel, then credit for a correct answer will depend on using the specified method. a. How many units of each sweater type should Fashionables order to maximize its expected profit? Use Table 13.4. 748 X b. If Fashionables wishes to ensure a 97.5 percent in-stock probability, what should its order quantity be for each type of sweater? Use Table 13.4. 942 Say Fashionables orders 750 of each sweater. What is Fashionables' expected profit? Use Table 13.4. 18,217 0.1586 Say Fashionables orders 750 of each sweater. What is the stockout probability for each sweater? Use Excel. (Round your answer to 4 decimal places.) TABLE 13.4 The Distribution, F(Q), and Expected Inventory, I(Q), Functions for the Standard Normal Distribution Function Fiz) A(z) -4.0 .0000 .0000 -3.9 -3.8 -3.7 -3.6 .000 .000 .000 0002 .0002 .0000 .0000 .0000 .0000 .0001 .0003 .0001 .0005 .0001 .0007 .0002 .0003 .0010 .0013 .0004 -2.9 .0019 .0005 -2.8 .0026 .0008 .0011 -2.7 -2.6 .0035 .0047 .0015 .0062 .0020 0082 .0027 -2.4 -2.3 0107 .0037 -22 .0139 .0049 .0179 0065 .0228 0085 .0287 .0111 -2.0 -1.9 -1.8 -17 0359 .0143 0446 .0183 -1.6 .0548 .0232 1.0668 0293 0808 10367 0968 0455 1.1151 10561 1357 0686 1587 10833 -0.9 1841 1004 219 1202 -0.8 -0.7 -0.6 2420 11429 1687 1978 -0.5 -04 -0.3 -0.2 2 2743 3085 | 3446 3821 1.4207 | 4602 5000 5 398 5 793 16179 6554 3 2304 668 3069 509 3989 4509 5069 0 1 2 5668 4 6 304 16915 6978 7257 7687 7580 8429 8 78819202 8159 1.0004 8413 1.0833 1.1686 8643 18849 12561 19032 13455 19192 1.4367 19332 1.5293 9452 1.6232 19554 1.7183 1.8143 191 19641 9713 | 9772 19821 2.0085 2.1065 18 19 20 21 12. 23 24 2.5 2 9 9 861 893 19918 9938 2.2049 23037 24027 2.5020 2.6015 19953 19965 2.7011 19974 2.8008 19981 2.9005 19987 3.0004 19990 3.1003 19993 3.2002 19995 3.3001 19997 3.4001 3.4 | 35 9998 3.5001 9998 3.6000 19999 37000 19999 3.8000 39 10000 3.9000 0 | 4. 1 .0000 4.0000 Fashionables is a franchisee of The Unlimited, the well-known retailer of fashionable clothing. Prior to the winter season, The Unlimited offers Fashionables the choice of five different colors of a particular sweater design. The sweaters are knit overseas by hand, because of the lead times involved, Fashionables will need to order its assortment in advance of the selling season. As per the contracting terms offered by The Unlimited, Fashionables will also not be able to cancel, modify, or reorder sweaters during the selling season. Demand for each color during the season is normally distributed with a mean of 550 and a standard deviation of 200. Further, you may assume that the demands for each sweater are independent of those for a different color. Use Table 13.4 The Unlimited offers the sweaters to Fashionables at the wholesale price of $37 per sweater, and Fashionables plans to sell each sweater at the retail price of $74 per unit. The Unlimited does not accept any returns of unsold inventory. However, Fashionables can sell all of the unsold sweaters at the end of the season at the fire-sale price of $24 each. If a part of the question specifies whether to use Table 13.4, or to use Excel, then credit for a correct answer will depend on using the specified method. a. How many units of each sweater type should Fashionables order to maximize its expected profit? Use Table 13.4. 748 X b. If Fashionables wishes to ensure a 97.5 percent in-stock probability, what should its order quantity be for each type of sweater? Use Table 13.4. 942 Say Fashionables orders 750 of each sweater. What is Fashionables' expected profit? Use Table 13.4. 18,217 0.1586 Say Fashionables orders 750 of each sweater. What is the stockout probability for each sweater? Use Excel. (Round your answer to 4 decimal places.) TABLE 13.4 The Distribution, F(Q), and Expected Inventory, I(Q), Functions for the Standard Normal Distribution Function Fiz) A(z) -4.0 .0000 .0000 -3.9 -3.8 -3.7 -3.6 .000 .000 .000 0002 .0002 .0000 .0000 .0000 .0000 .0001 .0003 .0001 .0005 .0001 .0007 .0002 .0003 .0010 .0013 .0004 -2.9 .0019 .0005 -2.8 .0026 .0008 .0011 -2.7 -2.6 .0035 .0047 .0015 .0062 .0020 0082 .0027 -2.4 -2.3 0107 .0037 -22 .0139 .0049 .0179 0065 .0228 0085 .0287 .0111 -2.0 -1.9 -1.8 -17 0359 .0143 0446 .0183 -1.6 .0548 .0232 1.0668 0293 0808 10367 0968 0455 1.1151 10561 1357 0686 1587 10833 -0.9 1841 1004 219 1202 -0.8 -0.7 -0.6 2420 11429 1687 1978 -0.5 -04 -0.3 -0.2 2 2743 3085 | 3446 3821 1.4207 | 4602 5000 5 398 5 793 16179 6554 3 2304 668 3069 509 3989 4509 5069 0 1 2 5668 4 6 304 16915 6978 7257 7687 7580 8429 8 78819202 8159 1.0004 8413 1.0833 1.1686 8643 18849 12561 19032 13455 19192 1.4367 19332 1.5293 9452 1.6232 19554 1.7183 1.8143 191 19641 9713 | 9772 19821 2.0085 2.1065 18 19 20 21 12. 23 24 2.5 2 9 9 861 893 19918 9938 2.2049 23037 24027 2.5020 2.6015 19953 19965 2.7011 19974 2.8008 19981 2.9005 19987 3.0004 19990 3.1003 19993 3.2002 19995 3.3001 19997 3.4001 3.4 | 35 9998 3.5001 9998 3.6000 19999 37000 19999 3.8000 39 10000 3.9000 0 | 4. 1 .0000 4.0000


