

Question: For part A create 6 intervals or groupings and present them in descending order.Add three more columns to the frequency table: percentage % ,
For part A create 6 intervals or groupings and present them indescendingorder.Add three more columns to the frequency table:"percentage %," "Cumulative Frequency,"and "Cumulative percentage%." All percentage display must include two decimal places, practice rounding if the calculation results call for rounding.
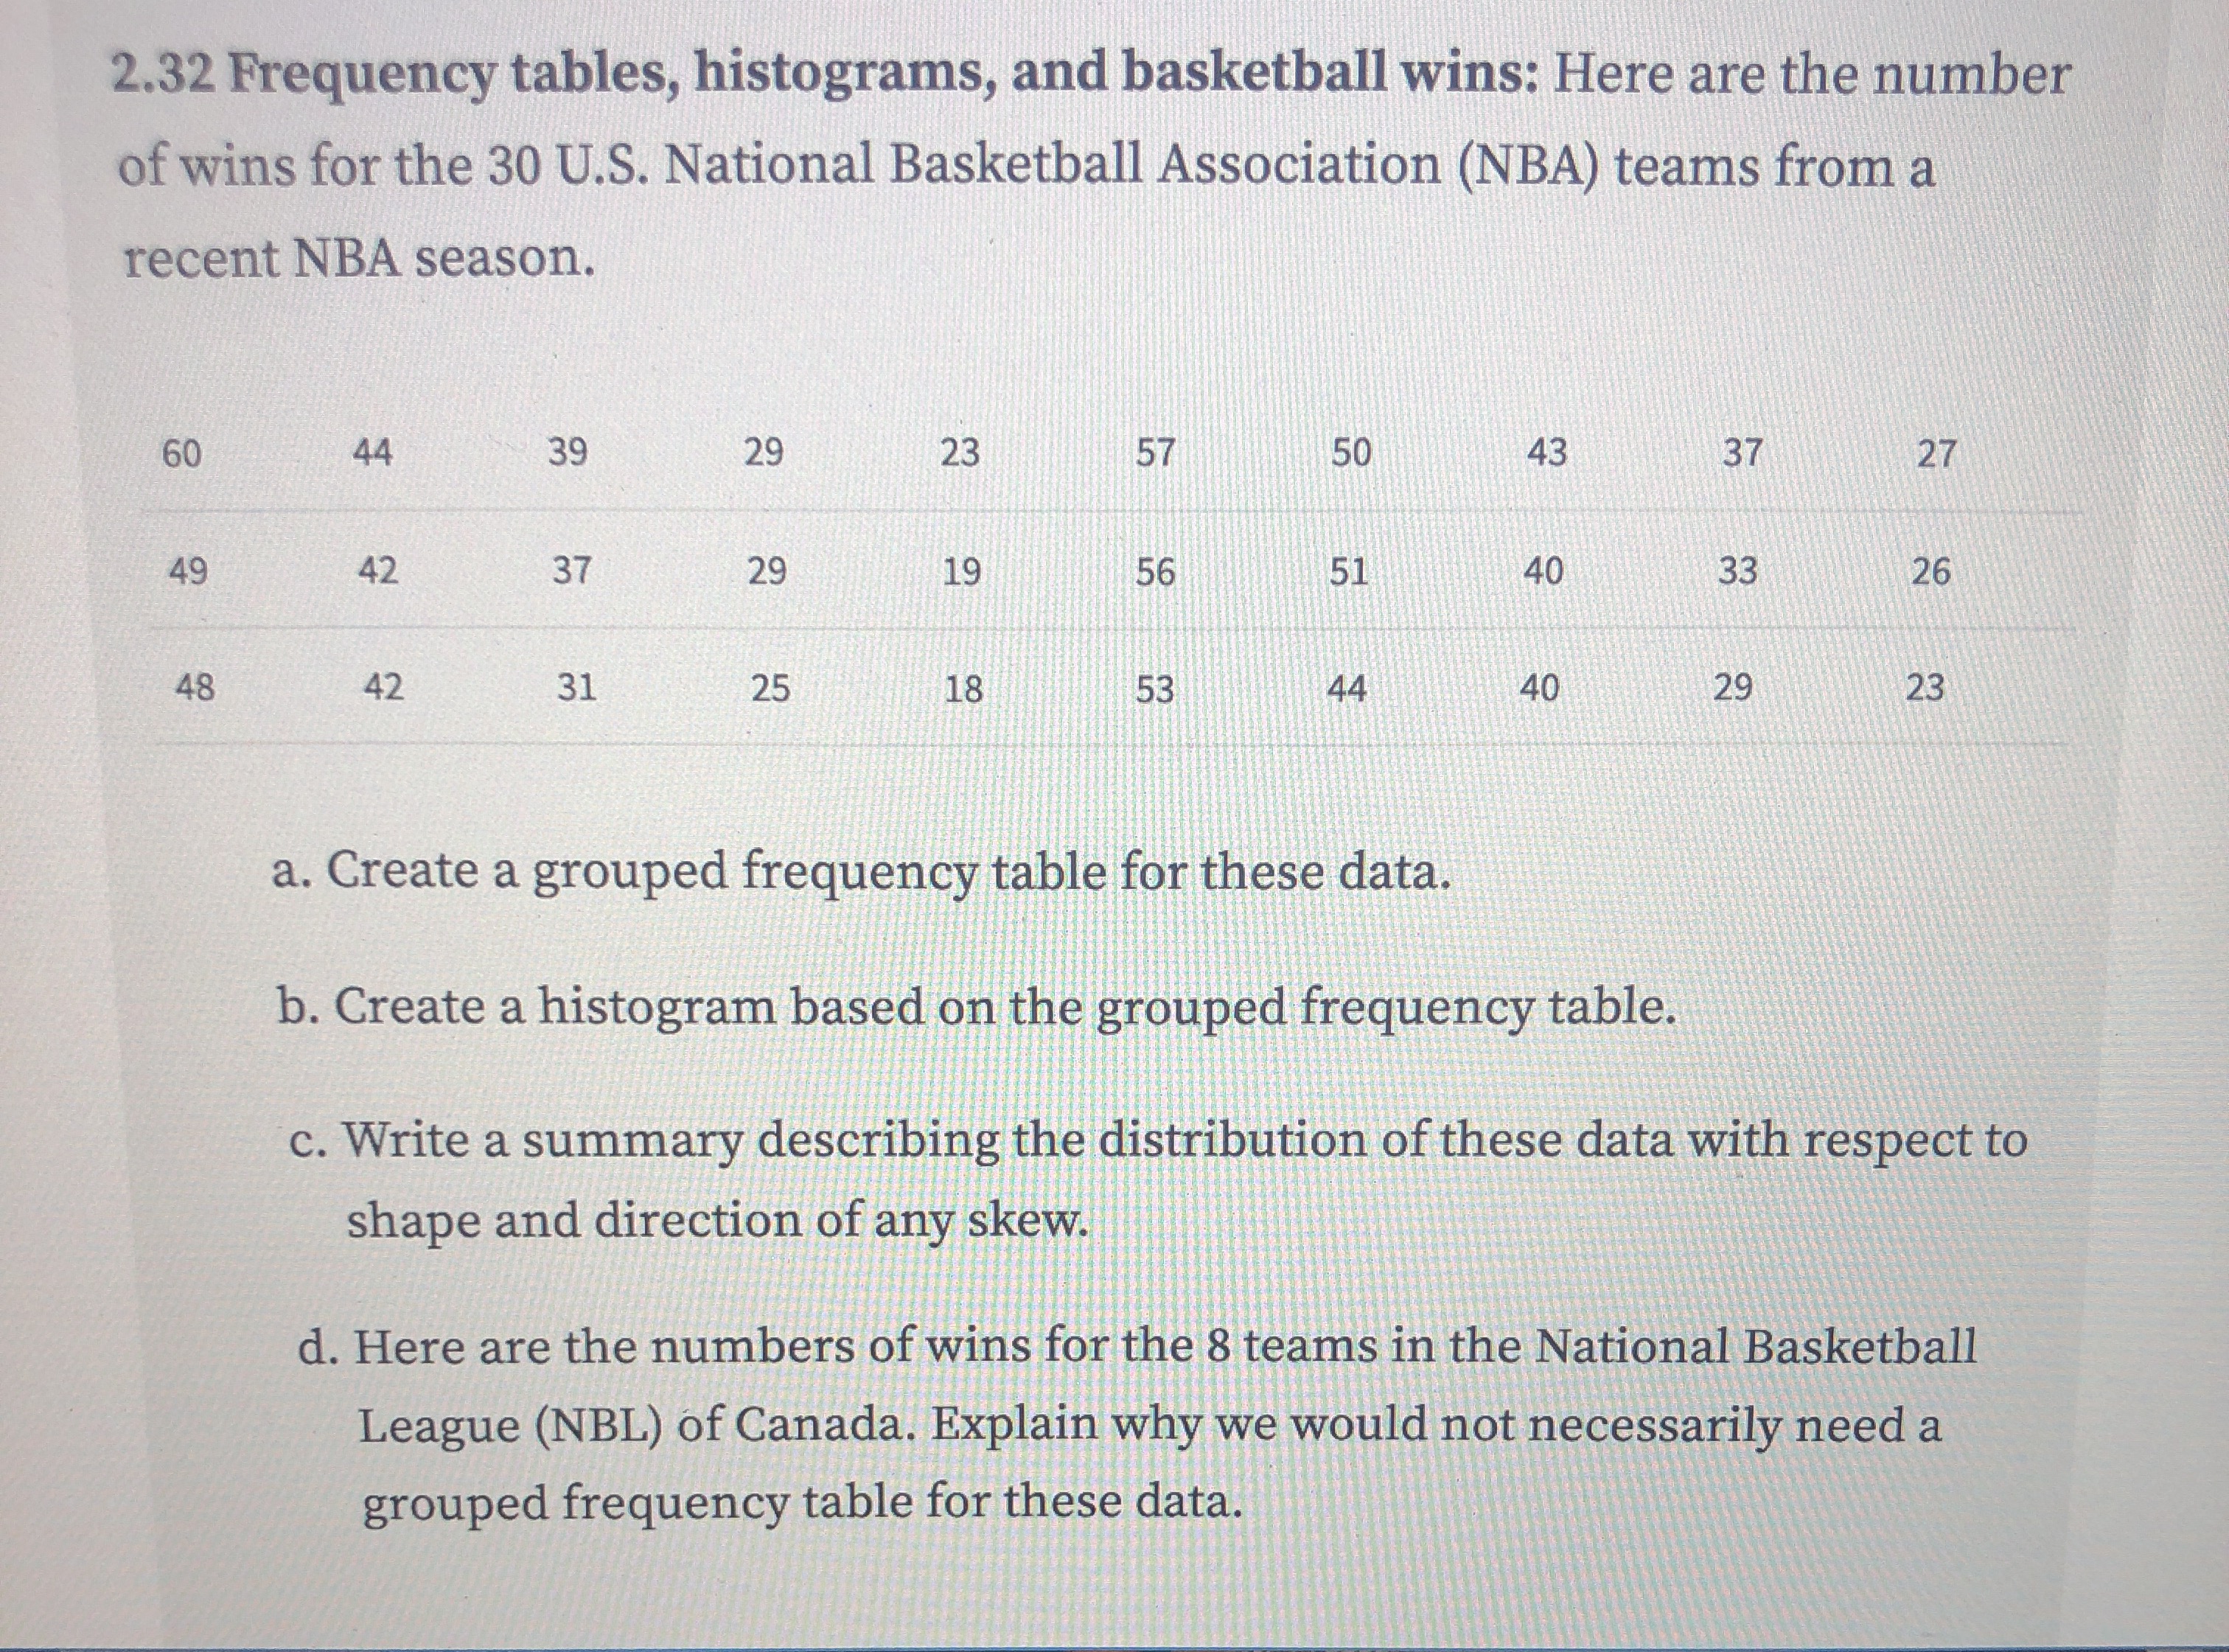
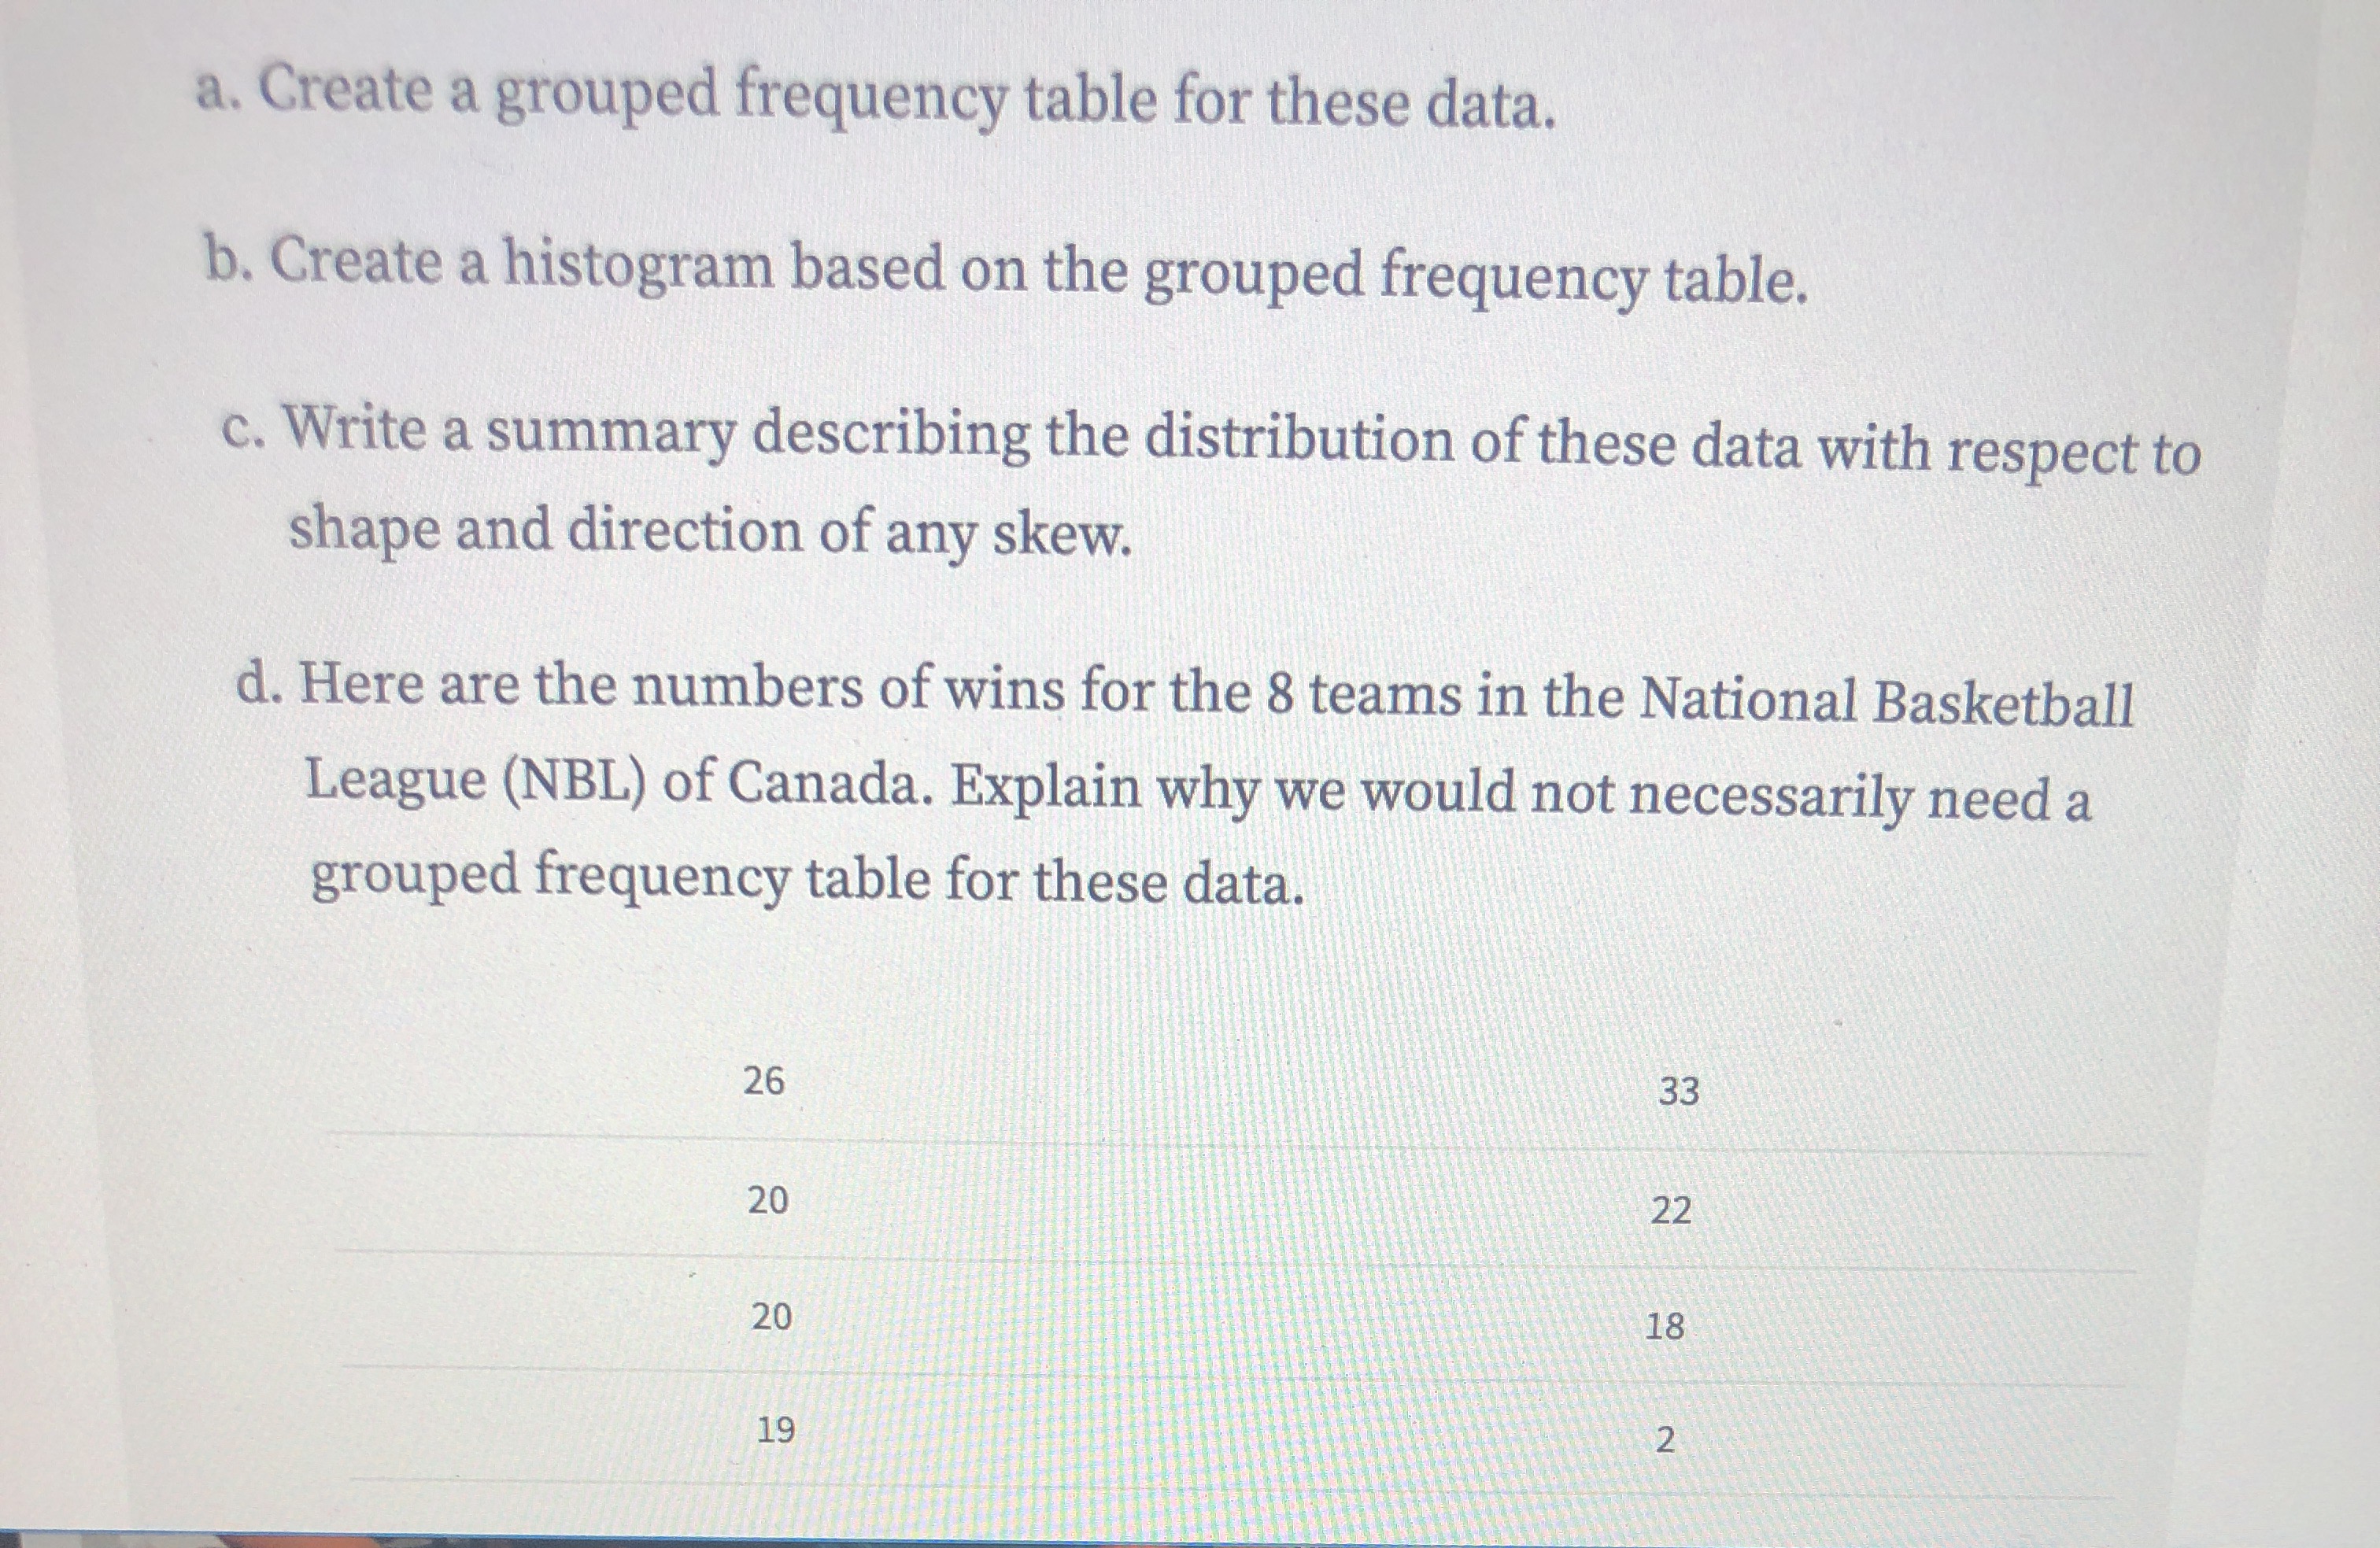
2.32 Frequency tables, histograms, and basketball wins: Here are the number of wins for the 30 U.S. National Basketball Association (NBA) teams from a recent NBA season. 60 44 39 29 23 57 50 43 37 27 49 42 37 29 19 56 51 40 33 26 48 42 31 25 18 53 44 40 29 23 a. Create a grouped frequency table for these data. b. Create a histogram based on the grouped frequency table. c. Write a summary describing the distribution of these data with respect to shape and direction of any skew. d. Here are the numbers of wins for the 8 teams in the National Basketball League (NBL) of Canada. Explain why we would not necessarily need a grouped frequency table for these data.a. Create a grouped frequency table for these data. b. Create a histogram based on the grouped frequency table. c. Write a summary describing the distribution of these data with respect to shape and direction of any skew. d. Here are the numbers of wins for the 8 teams in the National Basketball League (NBL) of Canada. Explain why we would not necessarily need a grouped frequency table for these data. 26 33 20 22 20 18 19 2
Step by Step Solution
There are 3 Steps involved in it

Get step-by-step solutions from verified subject matter experts