

Question: For Problem 12, run a multiple regression analysis and evaluate the model by performing and responding to all parts of the Multiple Regression Analysis
- For Problem 12, run a multiple regression analysis and evaluate the model by performing and responding to all parts of the "Multiple Regression Analysis Checklist." Also, respond to the stated questions in the problem. Use the Palisade DecisionTools Excel software to perform the regression analysis
Problem 12 from Chapter 13Practical Management Science, 6th Edition:
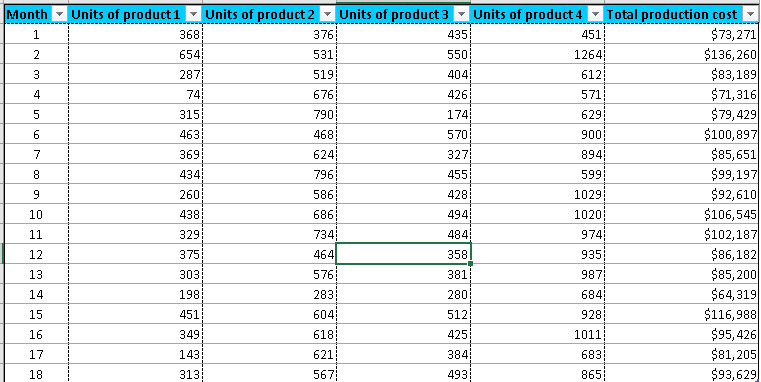
Suppose you are an analyst for a company that produces four products, and you are trying to decide how much of each product to produce next month. To model this decision problem, you need the unit variable production cost for each product. After some digging, you find the historical data on production levels and costs in the file P13_12.xlsx. Use these data to find estimates of the unit costs you need. You should also find an estimate of the fixed cost of production. Will this be of any use to you in deciding how much of each product to produce? Why or why not?
Data:
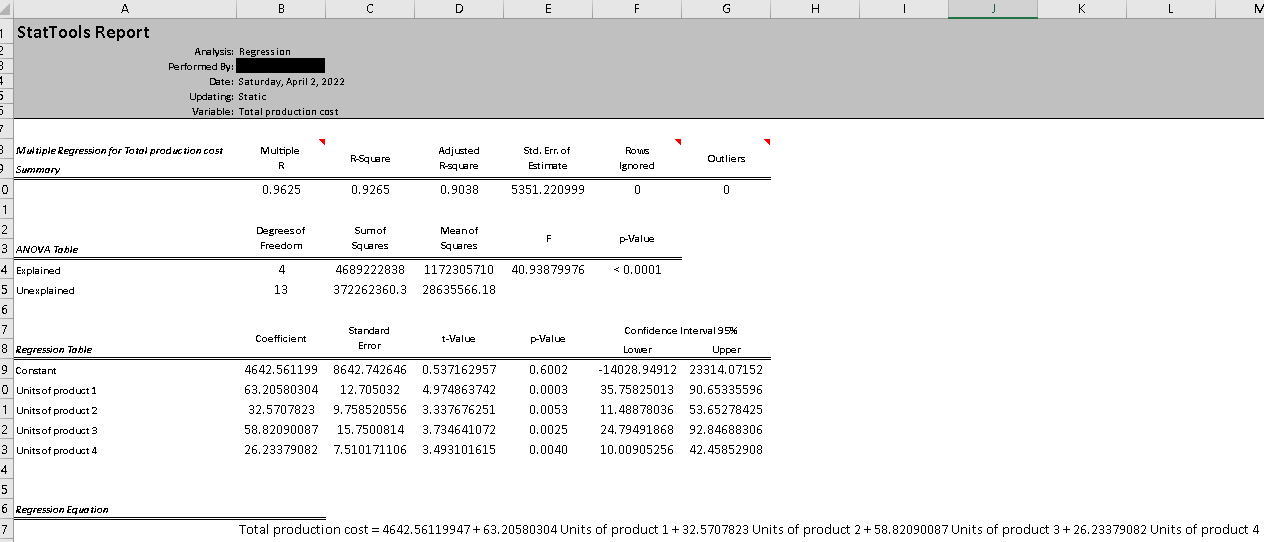
These are the results of the regression analysis performed with Palisade DecisionTools:
Multiple Regression Analysis Checklist:
- What is the analyst trying to determine?
- What are the variables? List the Dependent and Independent variables.
- State the null hypothesis, H0, and the alternative hypothesis, H1
- Run the linear regression. What is the linear equation? Interpret it.
- Select a level of significance (assume = 0.05)
- What is the overall statistical significance (i.e., what is the overall p-value)? Reject or not reject H0?
- Assess the statistical significance for each independent variable. Drop/retain appropriate variables accordingly.
- Run a correlation analysis and assess the possibility of multicollinearity.
- Run several regression analyses as needed to derive a final best fit model.
- Interpret the Adjusted R2 value for the overall model.
- Interpret the Standard Error value for the overall model.
- Run the standardized residualscheck for outliers (report discovered outliers)
- Assess normality in standardized residuals distribution.
- What is the conclusion of this regression analysis? Is the predictive equation a good one?
Step by Step Solution
There are 3 Steps involved in it

Get step-by-step solutions from verified subject matter experts