

Question: For problem 3 use Excel to answer the question. Provide separate answers to each part the question (Copy and paste your Excel answers to your
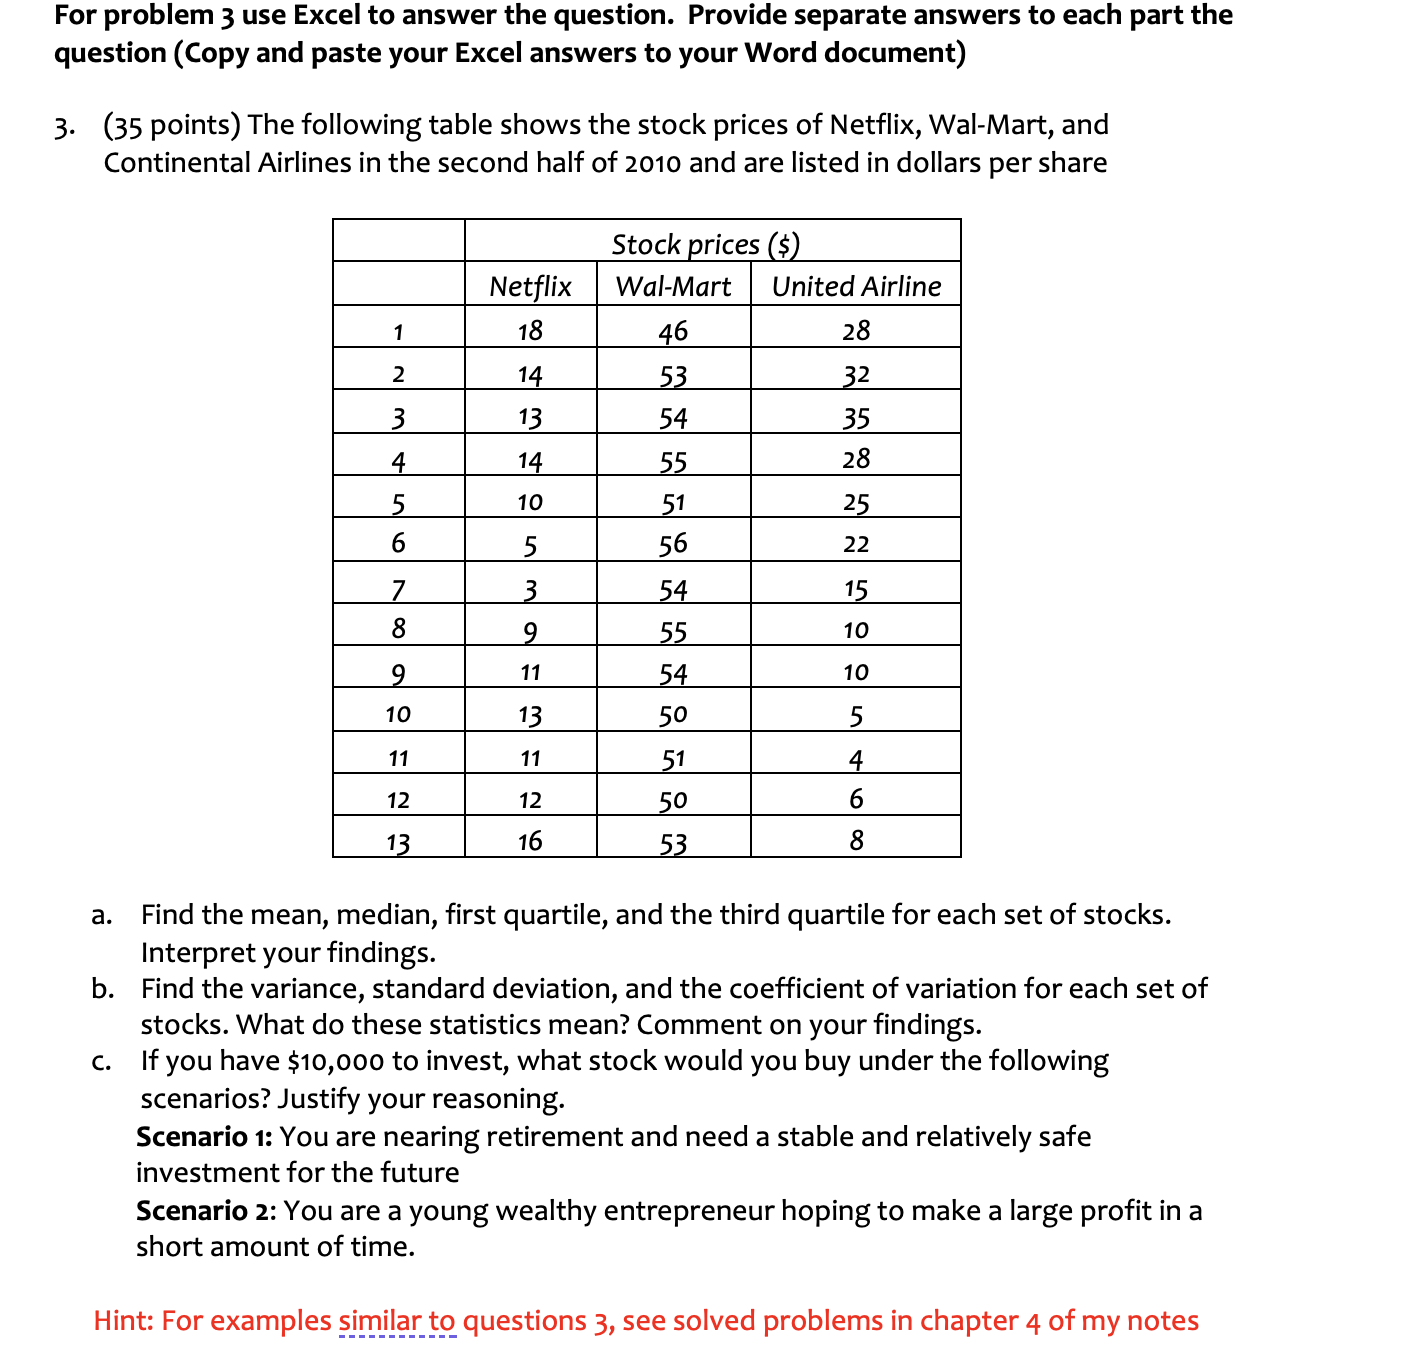
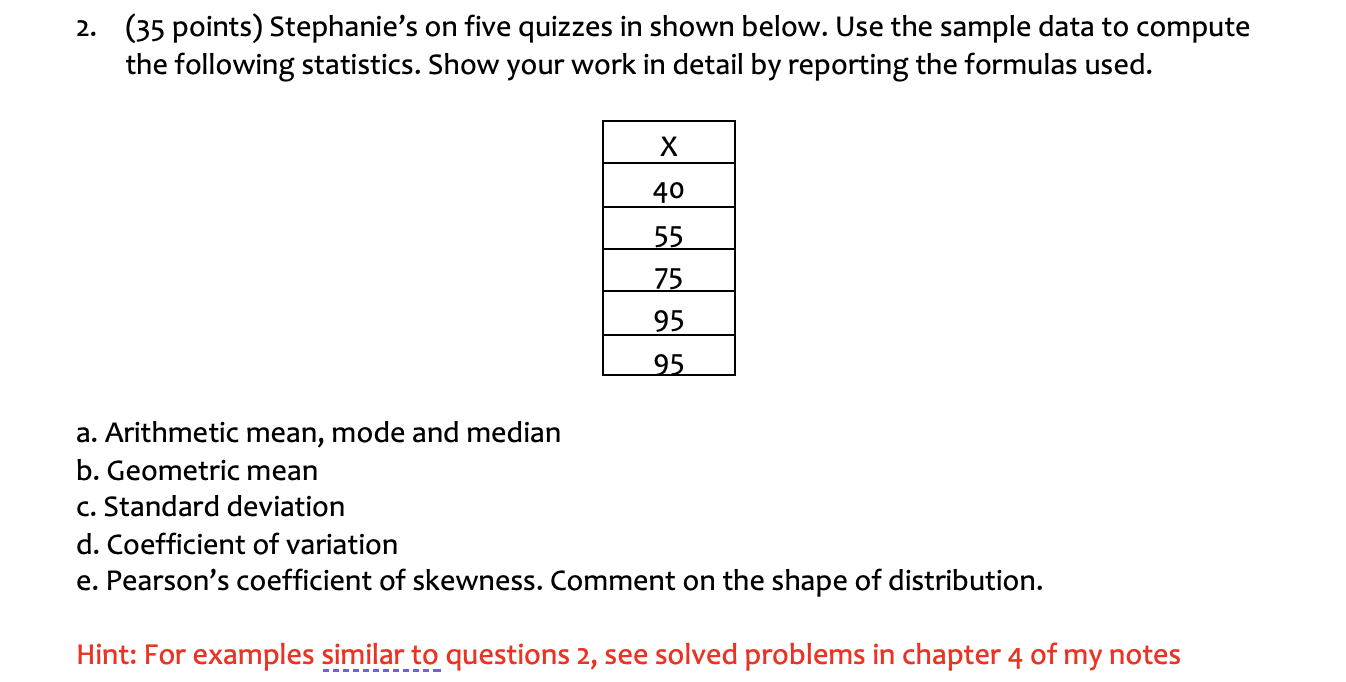
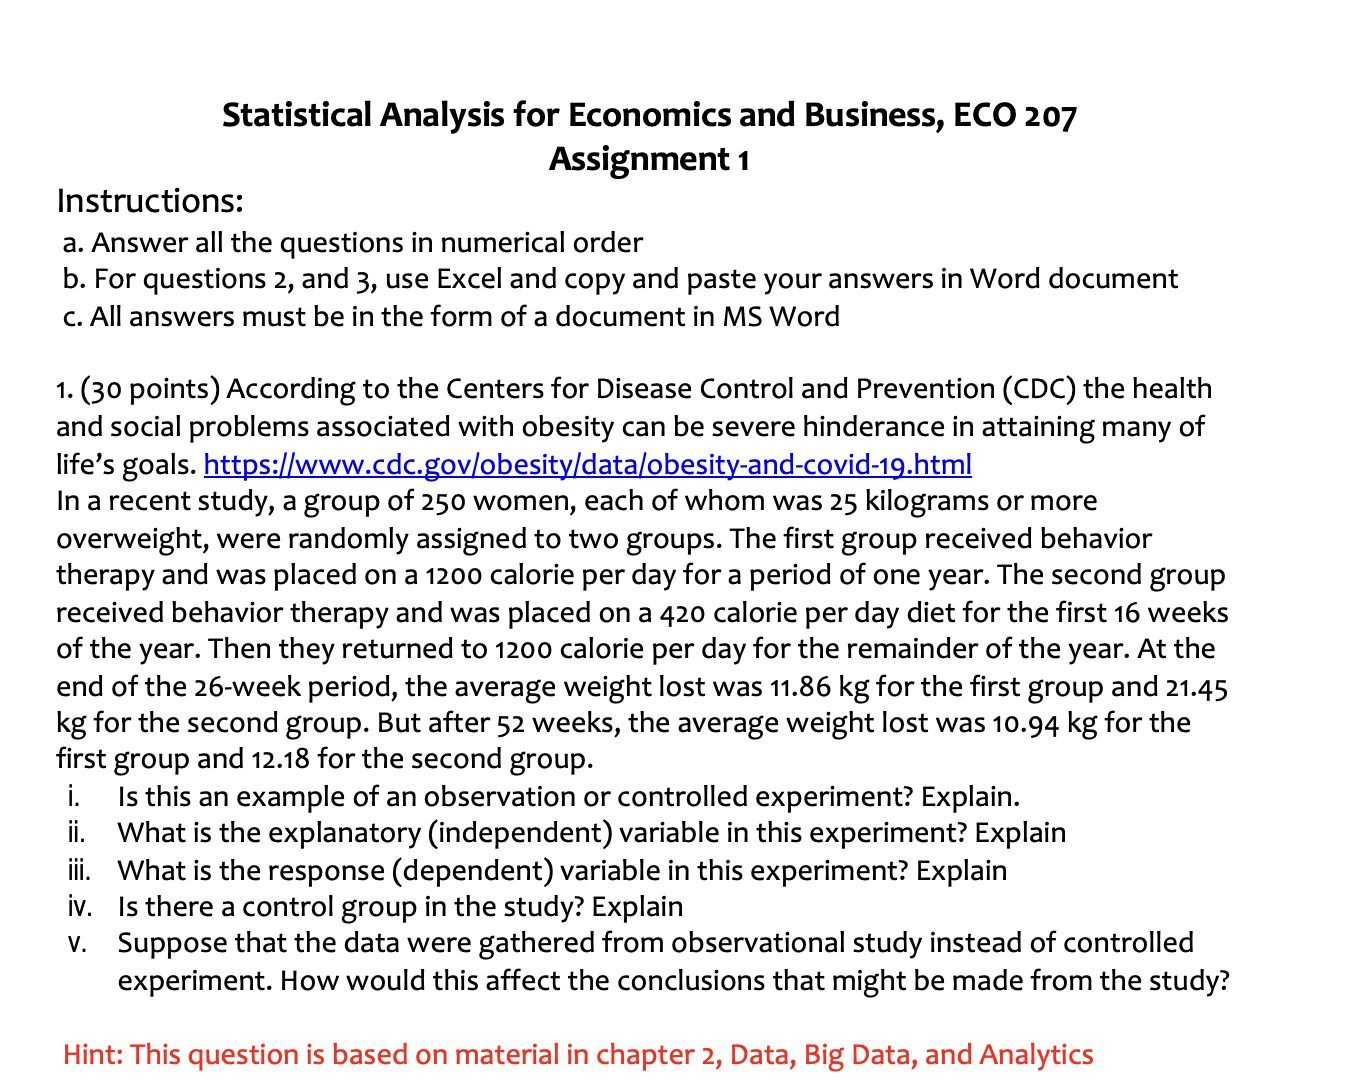
For problem 3 use Excel to answer the question. Provide separate answers to each part the question (Copy and paste your Excel answers to your Word document) 3. (35 points) The following table shows the stock prices of Netflix, Wal-Mart, and Continental Airlines in the second half of 2010 and are listed in dollars per share | | stockprices(s) - 1 a. Find the mean, median, first quartile, and the third quartile for each set of stocks. Interpret your findings. b. Find the variance, standard deviation, and the coefficient of variation for each set of stocks. What do these statistics mean? Comment on your findings. c. If you have $10,000 to invest, what stock would you buy under the following scenarios? Justify your reasoning. Scenario 1: You are nearing retirement and need a stable and relatively safe investment for the future Scenario 2: You are a young wealthy entrepreneur hoping to make a large profitina short amount of time. 2. (35 points) Stephanie's on five quizzes in shown below. Use the sample data to compute the following statistics. Show your work in detail by reporting the formulas used. a. Arithmetic mean, mode and median b. Geometric mean . Standard deviation d. Coefficient of variation e. Pearson's coefficient of skewness. Comment on the shape of distribution. Statistical Analysis for Economics and Business, ECO 207 Assignment 1 Instructions: a. Answer all the questions in numerical order b. For questions 2, and 3, use Excel and copy and paste your answers in Word document c. All answers must be in the form of a document in MS Word 1. (30 points) According to the Centers for Disease Control and Prevention (CDC) the health and social problems associated with obesity can be severe hinderance in attaining many of life's goals. https://www.cdc.gov/obesity/data/obesity-and-covid-19.html In a recent study, a group of 250 women, each of whom was 25 kilograms or more overweight, were randomly assigned to two groups. The first group received behavior therapy and was placed on a 1200 calorie per day for a period of one year. The second group received behavior therapy and was placed on a 420 calorie per day diet for the first 16 weeks of the year. Then they returned to 1200 calorie per day for the remainder of the year. At the end of the 26-week period, the average weight lost was 11.86 kg for the first group and 21.45 kg for the second group. But after 52 weeks, the average weight lost was 10.94 kg for the first group and 12.18 for the second group. i. Is this an example of an observation or controlled experiment? Explain. i. Whatis the explanatory (independent) variable in this experiment? Explain ii. Whatis the response (dependent) variable in this experiment? Explain iv. Isthere a control group in the study? Explain V. Suppose that the data were gathered from observational study instead of controlled experiment. How would this affect the conclusions that might be made from the study? Hint: This question is based on material in chapter 2, Data, Big Data, and Analytics
Step by Step Solution
There are 3 Steps involved in it

Get step-by-step solutions from verified subject matter experts