

Question: For problem, please show at minimum: 1) The null and alternative hypotheses, written using proper notation 2) The test statistic calculation showing: a. For the
For problem, please show at minimum:
1) The null and alternative hypotheses, written using proper notation
2) The test statistic calculation showing:
a. For the first problem, show the letter of the test statistic (chi-square or F), the formula for the test statistic, the numbers filled into the formula, and the final result. Round ? test test statistics to three decimals; round Ftest test statistics to two decimals.
b. For the second problem, show one example calculation of each type, and then fill in the calculation tables. You do not need to write out repetitive calculations. Keep four decimals on intermediate calculations. The test statistic can be rounded to three.
3) The rejection step showing BOTH the p-value approach AND the CV approach. You do not need to draw the rejection diagram unless you want to. You must show the proper p-value and proper CV or CVs, and the rejection rule (whether in numbers or with the diagram) that led you to your decision about the null hypothesis. State what happened to the null and the alternative hypotheses to get full credit.
4) Interpret the test result, referencing the alpha significance level (or percent confidence level), and answering all questions asked.
Q.... A hand cream company was interested in whether customers' preferences for hand cream are related to their parental status. On a recent survey of a random sample of 250 customers, the company asked: "Do you have children under five years of age that live with you?" The customer answered "Yes" if they had
children under 5 years of age, and "No" if they did not. The customers were also asked: "What is the most important characteristic you consider when choosing a hand cream?" The answer choices were: nice scent; longlasting; non-greasy; and all-natural.
The company would like you to perform a Test of Independence to determine if hand cream preference is related to parental status, at the ? = 0.10 significance level. Is there evidence that these two variables are related in the population of customers?
The observed frequencies from the sample are given in the following table:
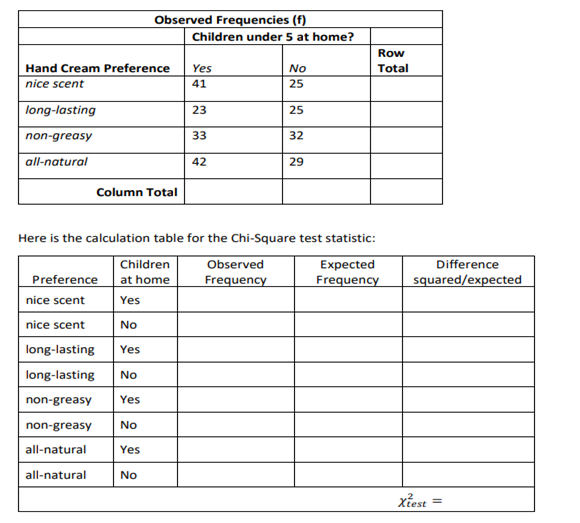
Observed Frequencies (f) Children under 5 at home? Row Hand Cream Preference Yes No Total nice scent 41 25 long-lasting 23 25 non-greasy 33 32 all-natural 42 29 Column Total Here is the calculation table for the Chi-Square test statistic: Children Observed Expected Difference Preference at home Frequency Frequency squared/expected nice scent Yes nice scent No long-lasting Yes long-lasting No non-greasy Yes non-greasy No all-natural Yes all-natural No Xiest =
Step by Step Solution
There are 3 Steps involved in it

Get step-by-step solutions from verified subject matter experts