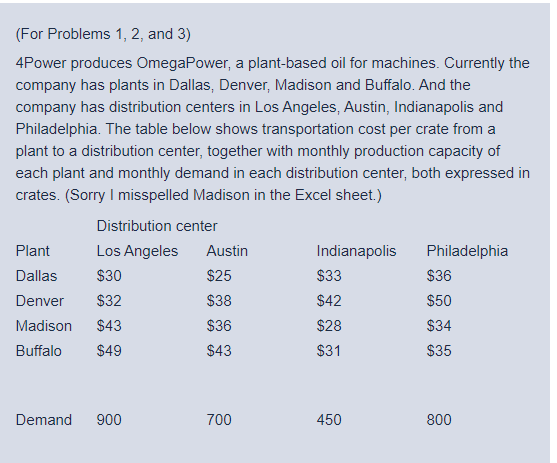
(For Problems 1, 2, and 3) 4Power produces OmegaPower, a plant-based oil for machines. Currently the company has plants in Dallas, Denver, Madison and Buffalo. And the company has distribution centers in Los Angeles, Austin, Indianapolis and Philadelphia. The table below shows transportation cost per crate from a plant to a distribution center, together with monthly production capacity of each plant and monthly demand in each distribution center, both expressed in crates. (Sorry I misspelled Madison in the Excel sheet.) Distribution center Plant Los Angeles Austin Indianapolis Philadelphia Dallas $30 $25 $33 $36 Denver $32 $38 $42 $50 Madison $43 $36 $28 $34 Buffalo $49 $43 $31 $35 Demand 900 700 450 800 plant produces below capacity in the originally given demand scenario. Now let us assume the demand for Los Angeles distribution center increases to 1,050 crates/month. After the process of optimization to minimize the total transportation cost, we see plant delivers more to Los Angeles. Austin distribution center receives more from plant Denver Indianapolis Austin Dallas Philadelphia Madison Los Angeles Buffalo Please bring back the demand for the Los Angeles distribution center to 900 crates, as the original scenario says. Now let us assume the transportation cost from Madison to Philadelphia jumps to $38/crate. The total minimum monthly transportation cost is $ (For Problems 1, 2, and 3) 4Power produces OmegaPower, a plant-based oil for machines. Currently the company has plants in Dallas, Denver, Madison and Buffalo. And the company has distribution centers in Los Angeles, Austin, Indianapolis and Philadelphia. The table below shows transportation cost per crate from a plant to a distribution center, together with monthly production capacity of each plant and monthly demand in each distribution center, both expressed in crates. (Sorry I misspelled Madison in the Excel sheet.) Distribution center Plant Los Angeles Austin Indianapolis Philadelphia Dallas $30 $25 $33 $36 Denver $32 $38 $42 $50 Madison $43 $36 $28 $34 Buffalo $49 $43 $31 $35 Demand 900 700 450 800 plant produces below capacity in the originally given demand scenario. Now let us assume the demand for Los Angeles distribution center increases to 1,050 crates/month. After the process of optimization to minimize the total transportation cost, we see plant delivers more to Los Angeles. Austin distribution center receives more from plant Denver Indianapolis Austin Dallas Philadelphia Madison Los Angeles Buffalo Please bring back the demand for the Los Angeles distribution center to 900 crates, as the original scenario says. Now let us assume the transportation cost from Madison to Philadelphia jumps to $38/crate. The total minimum monthly transportation cost is $


