

Question: For python (jupyterlab) Write code for a FUNCTION which draws zeros (denoted by 'o') and poles (denoted by 'X') for a given frequency response on
 For python (jupyterlab)
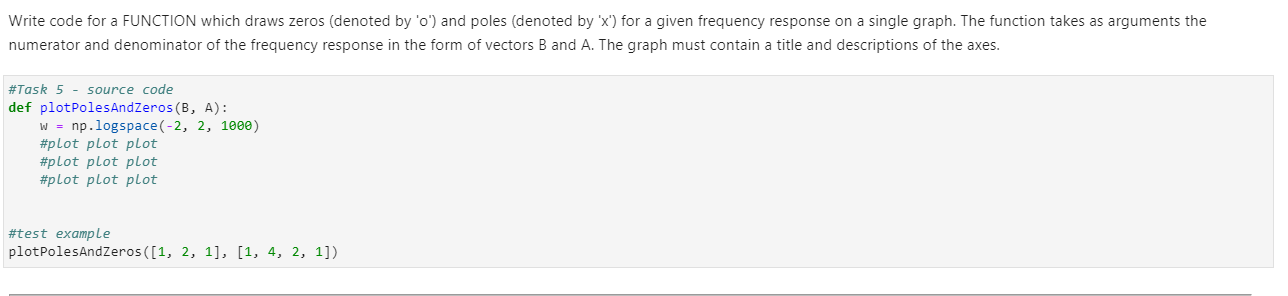
Write code for a FUNCTION which draws zeros (denoted by 'o') and poles (denoted by 'X') for a given frequency response on a single graph. The function takes as arguments the numerator and denominator of the frequency response in the form of vectors B and A. The graph must contain a title and descriptions of the axes. #Task 5 - source code def plotPolesAndZeros (B,A): W = np.logspace(-2, 2, 1000) #plot plot plot #plot plot plot #plot plot plot #test example plotPolesAndZeros([1, 2, 1], [1, 4, 2, 1]) Write code for a FUNCTION which draws zeros (denoted by 'o') and poles (denoted by 'X') for a given frequency response on a single graph. The function takes as arguments the numerator and denominator of the frequency response in the form of vectors B and A. The graph must contain a title and descriptions of the axes. #Task 5 - source code def plotPolesAndZeros (B,A): W = np.logspace(-2, 2, 1000) #plot plot plot #plot plot plot #plot plot plot #test example plotPolesAndZeros([1, 2, 1], [1, 4, 2, 1])
Step by Step Solution
There are 3 Steps involved in it

Get step-by-step solutions from verified subject matter experts