

Question: For question 1 can you solve post money valuation, Total shares, and % ownership to conclude that jeffrey owns 48% by the end Question 2
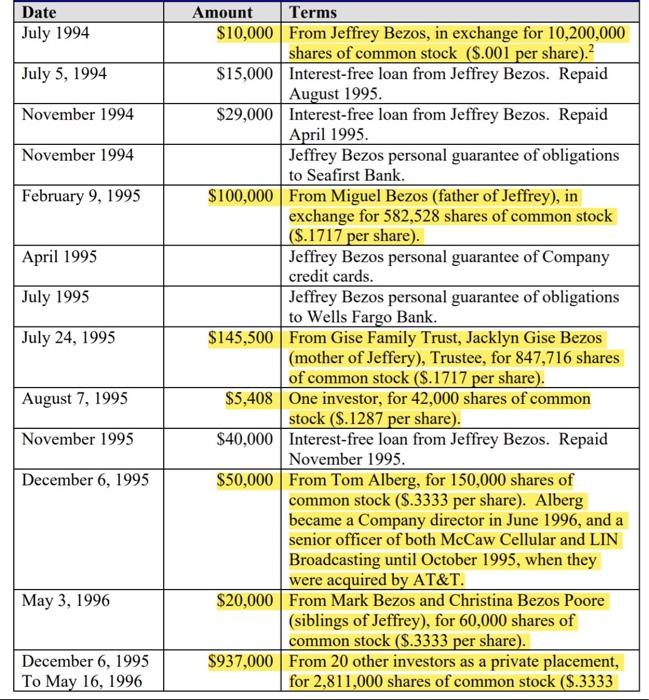
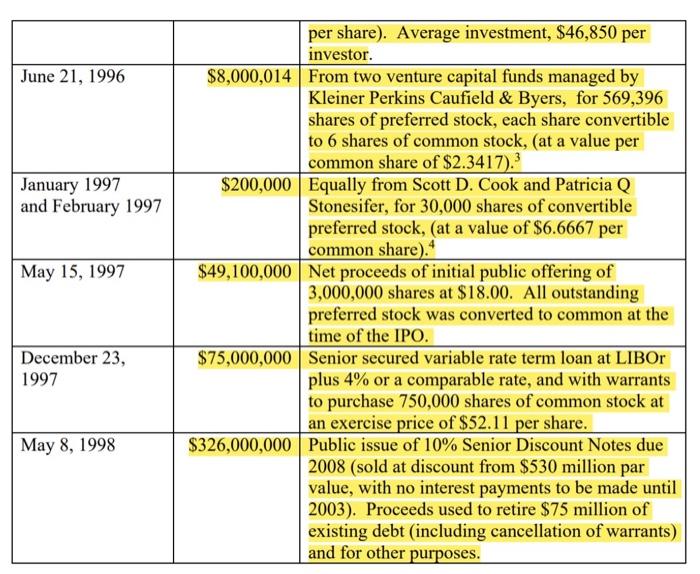
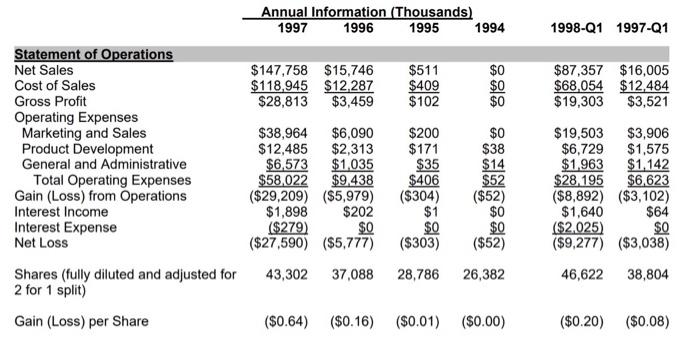
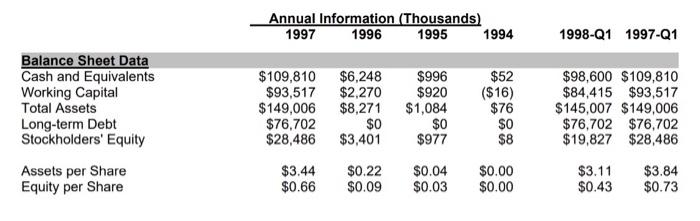
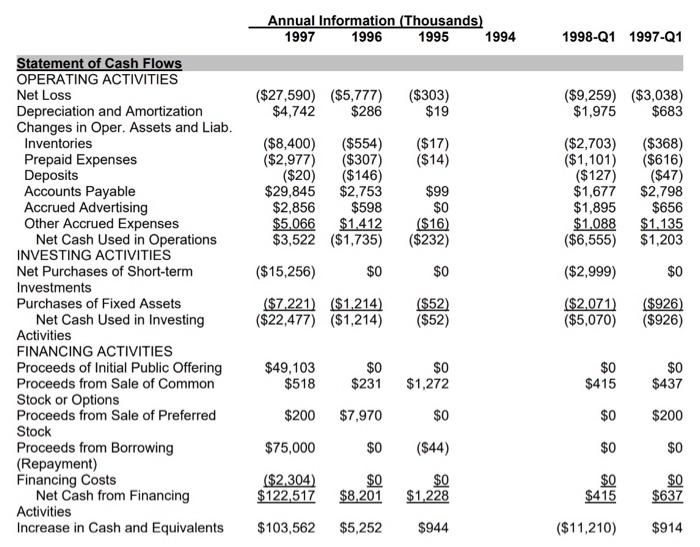
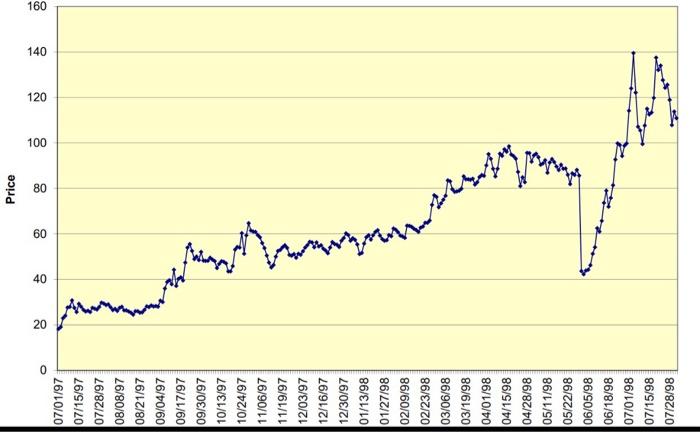
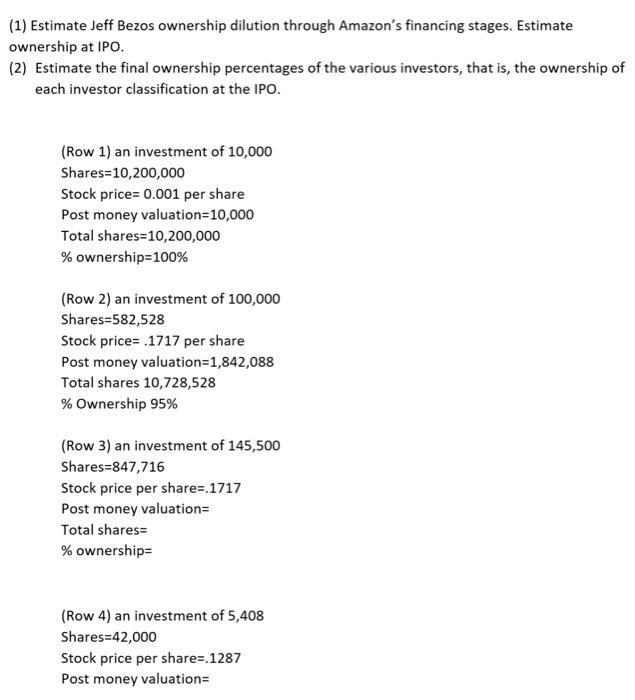
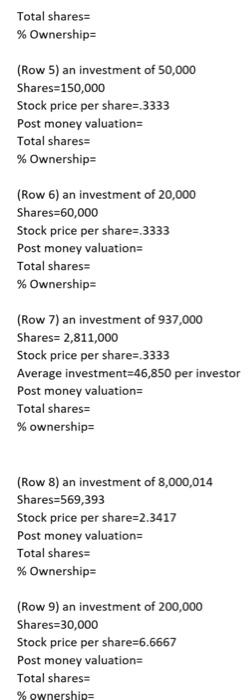
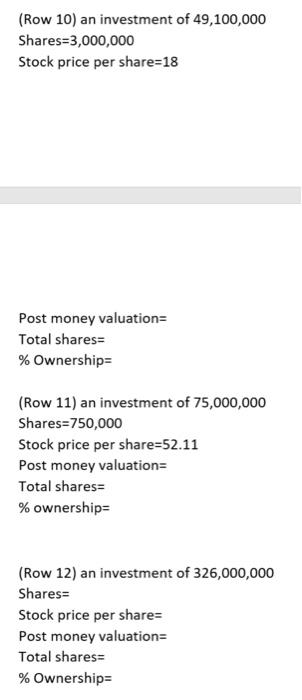
Date July 1994 July 5, 1994 November 1994 November 1994 February 9, 1995 April 1995 July 1995 July 24, 1995 Amount Terms $10,000 From Jeffrey Bezos, in exchange for 10,200,000 shares of common stock (9.001 per share). $15,000 Interest-free loan from Jeffrey Bezos. Repaid August 1995. $29,000 Interest-free loan from Jeffrey Bezos. Repaid April 1995. Jeffrey Bezos personal guarantee of obligations to Seafirst Bank. $100,000 From Miguel Bezos (father of Jeffrey), in exchange for 582,528 shares of common stock (S.1717 per share). Jeffrey Bezos personal guarantee of Company credit cards. Jeffrey Bezos personal guarantee of obligations to Wells Fargo Bank. $145,500 From Gise Family Trust, Jacklyn Gise Bezos (mother of Jeffery), Trustee, for 847,716 shares of common stock ($.1717 per share). $5,408 One investor, for 42,000 shares of common stock ($.1287 per share). $40,000 Interest-free loan from Jeffrey Bezos. Repaid November 1995. $50,000 From Tom Alberg, for 150,000 shares of common stock ($.3333 per share). Alberg became a Company director in June 1996, and a senior officer of both McCaw Cellular and LIN Broadcasting until October 1995, when they were acquired by AT&T. $20,000 From Mark Bezos and Christina Bezos Poore (siblings of Jeffrey), for 60,000 shares of common stock ($.3333 per share). $937,000 From 20 other investors as a private placement, for 2,811,000 shares of common stock ($.3333 August 7, 1995 November 1995 December 6, 1995 May 3, 1996 December 6, 1995 To May 16, 1996 June 21, 1996 January 1997 and February 1997 May 15, 1997 per share). Average investment, $46,850 per investor. $8,000,014 From two venture capital funds managed by Kleiner Perkins Caufield & Byers, for 569,396 shares of preferred stock, each share convertible to 6 shares of common stock, (at a value per common share of $2.3417). $200,000 Equally from Scott D. Cook and Patricia Q Stonesifer, for 30,000 shares of convertible preferred stock, (at a value of $6.6667 per common share).4 $49,100,000 Net proceeds of initial public offering of 3,000,000 shares at $18.00. All outstanding preferred stock was converted to common at the time of the IPO. $75,000,000 Senior secured variable rate term loan at LIBOr plus 4% or a comparable rate, and with warrants to purchase 750,000 shares of common stock at an exercise price of $52.11 per share. $326,000,000 Public issue of 10% Senior Discount Notes due 2008 (sold at discount from $530 million par value, with no interest payments to be made until 2003). Proceeds used to retire $75 million of existing debt (including cancellation of warrants) and for other purposes. December 23, 1997 May 8, 1998 Annual Information (Thousands) 1997 1996 1995 1994 1998-Q1 1997-Q1 $147,758 $15,746 $118.945 $12,287 $28,813 $3,459 $511 $409 $102 $0 $0 $0 $87,357 $16,005 $68,054 $12,484 $19,303 $3,521 Statement of Operations Net Sales Cost of Sales Gross Profit Operating Expenses Marketing and Sales Product Development General and Administrative Total Operating Expenses Gain (Loss) from Operations Interest Income Interest Expense Net Loss $38,964 $6,090 $12,485 $2,313 $6,573 $1.035 $58,022 $9.438 ($29,209) ($5,979) $1,898 $202 ($279) $0 ($27,590) ($5,777) $200 $171 $35 $406 ($304) $1 $0 ($303) $0 $38 $14 $52 ($52) $0 $0 ($52) $19,503 $3,906 $6,729 $1,575 $1,963 $1,142 $28.195 $6,623 ($8,892) ($3,102) $1,640 $64 ($2,025) $0 ($9,277) ($3,038) 43,302 37,088 28,786 26,382 46,622 38,804 Shares (fully diluted and adjusted for 2 for 1 split) Gain (Loss) per Share ($0.64) ($0.16) ($0.01) ($0.00) ($0.20) ($0.08) Annual Information (Thousands) 1997 1996 1995 1994 1998-Q1 1997-Q1 Balance Sheet Data Cash and Equivalents Working Capital Total Assets Long-term Debt Stockholders' Equity Assets per Share Equity per Share $109,810 $93,517 $149,006 $76,702 $28,486 $6,248 $2,270 $8,271 $0 $3,401 $996 $920 $1,084 $0 $977 $52 ($16) $76 SO $8 $98,600 $109,810 $84,415 $93,517 $145,007 $149,006 $76,702 $76,702 $19,827 $28,486 $3.44 $0.66 $0.22 $0.09 $0.04 $0.03 $0.00 $0.00 $3.11 $0.43 $3.84 $0.73 Annual Information (Thousands) 1997 1996 1995 1994 1998-Q1 1997-01 ($27,590) ($5,777) $4,742 $286 ($303) $19 ($17) ($14) ($8,400) ($554) ($2,977) ($307) ($20) ($146) $29,845 $2,753 $2,856 $598 $5,066 $1.412 $3,522 ($1,735) ($9,259) ($3,038) $1,975 $683 ($2,703) ($368) ($1,101) ($616) ($127) ($47) $1,677 $2,798 $1,895 $656 $1,088 $1,135 ($6,555) $1,203 $99 $0 ($16) ($232) ($15,256) $0 $0 ($2,999) $0 Statement of Cash Flows OPERATING ACTIVITIES Net Loss Depreciation and Amortization Changes in Oper. Assets and Liab. Inventories Prepaid Expenses Deposits Accounts Payable Accrued Advertising Other Accrued Expenses Net Cash Used in Operations INVESTING ACTIVITIES Net Purchases of Short-term Investments Purchases of Fixed Assets Net Cash Used in Investing Activities FINANCING ACTIVITIES Proceeds of Initial Public Offering Proceeds from Sale of Common Stock or Options Proceeds from Sale of Preferred Stock Proceeds from Borrowing (Repayment) Financing Costs Net Cash from Financing Activities Increase in Cash and Equivalents ($7.221) ($1.214) ($22,477) ($1,214) ($52) ($52) ($2,071) ($5,070) ($926) ($926) $49,103 $518 $0 $231 $0 $1,272 $0 $415 $0 $437 $200 $7,970 $0 $0 $200 $75,000 $0 (544) $0 $0 ($2,304) $122,517 $0 $8,201 $0 $1,228 $0 $415 $0 $637 $103,562 $5,252 $944 ($11,210) $914 Price o 20 40 60 80 100 120 140 160 07/01/97 07/15/97 07/28/97 08/08/97 08/21/97 09/04/97 09/17/97 09/30/97 10/13/97 10/24/97 11/06/97 11/19/97 12/03/97 12/16/97 12/30/97 wagon 01/13/98 01/27/98 02/09/98 02/23/98 03/06/98 03/19/98 04/01/98 04/15/98 04/28/98 05/11/98 05/22/98 06/05/98 06/18/98 Aswing 07/01/98 07/15/98 07/28/98 (1) Estimate Jeff Bezos ownership dilution through Amazon's financing stages. Estimate ownership at IPO. (2) Estimate the final ownership percentages of the various investors, that is, the ownership of each investor classification at the IPO. (Row 1) an investment of 10,000 Shares=10,200,000 Stock price=0.001 per share Post money valuation=10,000 Total shares=10,200,000 % ownership=100% (Row 2) an investment of 100,000 Shares=582,528 Stock price= .1717 per share Post money valuation=1,842,088 Total shares 10,728,528 % Ownership 95% (Row 3) an investment of 145,500 Shares=847,716 Stock price per share=1717 Post money valuation= Total shares % ownership- (Row 4) an investment of 5,408 Shares=42,000 Stock price per share=.1287 Post money valuations Total shares % Ownerships (Row 5) an investment of 50,000 Shares=150,000 Stock price per share= 3333 Post money valuation Total shares % Ownership (Row 6) an investment of 20,000 Shares=60,000 Stock price per share= 3333 Post money valuation Total shares % Ownership (Row 7) an investment of 937,000 Shares= 2,811,000 Stock price per share= 3333 Average investment=46,850 per investor Post money valuation Total shares % ownership (Row 8) an investment of 8,000,014 Shares=569,393 Stock price per share=2.3417 Post money valuation Total shares % Ownership (Row 9) an investment of 200,000 Shares=30,000 Stock price per share=6.6667 Post money valuation Total shares % ownerships (Row 10) an investment of 49,100,000 Shares=3,000,000 Stock price per share=18 Post money valuation= Total shares % Ownership (Row 11) an investment of 75,000,000 Shares=750,000 Stock price per share=52.11 Post money valuation= Total shares= % ownership (Row 12) an investment of 326,000,000 Shares Stock price per shares Post money valuation Total shares % Ownership Date July 1994 July 5, 1994 November 1994 November 1994 February 9, 1995 April 1995 July 1995 July 24, 1995 Amount Terms $10,000 From Jeffrey Bezos, in exchange for 10,200,000 shares of common stock (9.001 per share). $15,000 Interest-free loan from Jeffrey Bezos. Repaid August 1995. $29,000 Interest-free loan from Jeffrey Bezos. Repaid April 1995. Jeffrey Bezos personal guarantee of obligations to Seafirst Bank. $100,000 From Miguel Bezos (father of Jeffrey), in exchange for 582,528 shares of common stock (S.1717 per share). Jeffrey Bezos personal guarantee of Company credit cards. Jeffrey Bezos personal guarantee of obligations to Wells Fargo Bank. $145,500 From Gise Family Trust, Jacklyn Gise Bezos (mother of Jeffery), Trustee, for 847,716 shares of common stock ($.1717 per share). $5,408 One investor, for 42,000 shares of common stock ($.1287 per share). $40,000 Interest-free loan from Jeffrey Bezos. Repaid November 1995. $50,000 From Tom Alberg, for 150,000 shares of common stock ($.3333 per share). Alberg became a Company director in June 1996, and a senior officer of both McCaw Cellular and LIN Broadcasting until October 1995, when they were acquired by AT&T. $20,000 From Mark Bezos and Christina Bezos Poore (siblings of Jeffrey), for 60,000 shares of common stock ($.3333 per share). $937,000 From 20 other investors as a private placement, for 2,811,000 shares of common stock ($.3333 August 7, 1995 November 1995 December 6, 1995 May 3, 1996 December 6, 1995 To May 16, 1996 June 21, 1996 January 1997 and February 1997 May 15, 1997 per share). Average investment, $46,850 per investor. $8,000,014 From two venture capital funds managed by Kleiner Perkins Caufield & Byers, for 569,396 shares of preferred stock, each share convertible to 6 shares of common stock, (at a value per common share of $2.3417). $200,000 Equally from Scott D. Cook and Patricia Q Stonesifer, for 30,000 shares of convertible preferred stock, (at a value of $6.6667 per common share).4 $49,100,000 Net proceeds of initial public offering of 3,000,000 shares at $18.00. All outstanding preferred stock was converted to common at the time of the IPO. $75,000,000 Senior secured variable rate term loan at LIBOr plus 4% or a comparable rate, and with warrants to purchase 750,000 shares of common stock at an exercise price of $52.11 per share. $326,000,000 Public issue of 10% Senior Discount Notes due 2008 (sold at discount from $530 million par value, with no interest payments to be made until 2003). Proceeds used to retire $75 million of existing debt (including cancellation of warrants) and for other purposes. December 23, 1997 May 8, 1998 Annual Information (Thousands) 1997 1996 1995 1994 1998-Q1 1997-Q1 $147,758 $15,746 $118.945 $12,287 $28,813 $3,459 $511 $409 $102 $0 $0 $0 $87,357 $16,005 $68,054 $12,484 $19,303 $3,521 Statement of Operations Net Sales Cost of Sales Gross Profit Operating Expenses Marketing and Sales Product Development General and Administrative Total Operating Expenses Gain (Loss) from Operations Interest Income Interest Expense Net Loss $38,964 $6,090 $12,485 $2,313 $6,573 $1.035 $58,022 $9.438 ($29,209) ($5,979) $1,898 $202 ($279) $0 ($27,590) ($5,777) $200 $171 $35 $406 ($304) $1 $0 ($303) $0 $38 $14 $52 ($52) $0 $0 ($52) $19,503 $3,906 $6,729 $1,575 $1,963 $1,142 $28.195 $6,623 ($8,892) ($3,102) $1,640 $64 ($2,025) $0 ($9,277) ($3,038) 43,302 37,088 28,786 26,382 46,622 38,804 Shares (fully diluted and adjusted for 2 for 1 split) Gain (Loss) per Share ($0.64) ($0.16) ($0.01) ($0.00) ($0.20) ($0.08) Annual Information (Thousands) 1997 1996 1995 1994 1998-Q1 1997-Q1 Balance Sheet Data Cash and Equivalents Working Capital Total Assets Long-term Debt Stockholders' Equity Assets per Share Equity per Share $109,810 $93,517 $149,006 $76,702 $28,486 $6,248 $2,270 $8,271 $0 $3,401 $996 $920 $1,084 $0 $977 $52 ($16) $76 SO $8 $98,600 $109,810 $84,415 $93,517 $145,007 $149,006 $76,702 $76,702 $19,827 $28,486 $3.44 $0.66 $0.22 $0.09 $0.04 $0.03 $0.00 $0.00 $3.11 $0.43 $3.84 $0.73 Annual Information (Thousands) 1997 1996 1995 1994 1998-Q1 1997-01 ($27,590) ($5,777) $4,742 $286 ($303) $19 ($17) ($14) ($8,400) ($554) ($2,977) ($307) ($20) ($146) $29,845 $2,753 $2,856 $598 $5,066 $1.412 $3,522 ($1,735) ($9,259) ($3,038) $1,975 $683 ($2,703) ($368) ($1,101) ($616) ($127) ($47) $1,677 $2,798 $1,895 $656 $1,088 $1,135 ($6,555) $1,203 $99 $0 ($16) ($232) ($15,256) $0 $0 ($2,999) $0 Statement of Cash Flows OPERATING ACTIVITIES Net Loss Depreciation and Amortization Changes in Oper. Assets and Liab. Inventories Prepaid Expenses Deposits Accounts Payable Accrued Advertising Other Accrued Expenses Net Cash Used in Operations INVESTING ACTIVITIES Net Purchases of Short-term Investments Purchases of Fixed Assets Net Cash Used in Investing Activities FINANCING ACTIVITIES Proceeds of Initial Public Offering Proceeds from Sale of Common Stock or Options Proceeds from Sale of Preferred Stock Proceeds from Borrowing (Repayment) Financing Costs Net Cash from Financing Activities Increase in Cash and Equivalents ($7.221) ($1.214) ($22,477) ($1,214) ($52) ($52) ($2,071) ($5,070) ($926) ($926) $49,103 $518 $0 $231 $0 $1,272 $0 $415 $0 $437 $200 $7,970 $0 $0 $200 $75,000 $0 (544) $0 $0 ($2,304) $122,517 $0 $8,201 $0 $1,228 $0 $415 $0 $637 $103,562 $5,252 $944 ($11,210) $914 Price o 20 40 60 80 100 120 140 160 07/01/97 07/15/97 07/28/97 08/08/97 08/21/97 09/04/97 09/17/97 09/30/97 10/13/97 10/24/97 11/06/97 11/19/97 12/03/97 12/16/97 12/30/97 wagon 01/13/98 01/27/98 02/09/98 02/23/98 03/06/98 03/19/98 04/01/98 04/15/98 04/28/98 05/11/98 05/22/98 06/05/98 06/18/98 Aswing 07/01/98 07/15/98 07/28/98 (1) Estimate Jeff Bezos ownership dilution through Amazon's financing stages. Estimate ownership at IPO. (2) Estimate the final ownership percentages of the various investors, that is, the ownership of each investor classification at the IPO. (Row 1) an investment of 10,000 Shares=10,200,000 Stock price=0.001 per share Post money valuation=10,000 Total shares=10,200,000 % ownership=100% (Row 2) an investment of 100,000 Shares=582,528 Stock price= .1717 per share Post money valuation=1,842,088 Total shares 10,728,528 % Ownership 95% (Row 3) an investment of 145,500 Shares=847,716 Stock price per share=1717 Post money valuation= Total shares % ownership- (Row 4) an investment of 5,408 Shares=42,000 Stock price per share=.1287 Post money valuations Total shares % Ownerships (Row 5) an investment of 50,000 Shares=150,000 Stock price per share= 3333 Post money valuation Total shares % Ownership (Row 6) an investment of 20,000 Shares=60,000 Stock price per share= 3333 Post money valuation Total shares % Ownership (Row 7) an investment of 937,000 Shares= 2,811,000 Stock price per share= 3333 Average investment=46,850 per investor Post money valuation Total shares % ownership (Row 8) an investment of 8,000,014 Shares=569,393 Stock price per share=2.3417 Post money valuation Total shares % Ownership (Row 9) an investment of 200,000 Shares=30,000 Stock price per share=6.6667 Post money valuation Total shares % ownerships (Row 10) an investment of 49,100,000 Shares=3,000,000 Stock price per share=18 Post money valuation= Total shares % Ownership (Row 11) an investment of 75,000,000 Shares=750,000 Stock price per share=52.11 Post money valuation= Total shares= % ownership (Row 12) an investment of 326,000,000 Shares Stock price per shares Post money valuation Total shares % Ownership
Step by Step Solution
There are 3 Steps involved in it

Get step-by-step solutions from verified subject matter experts