

Question: For Question 1e, what code shall I write to create a histogram like this: Thank you so much! 23]: def integer_distribution(arr_ints): plt.hist(faces, bins=unit_bins, ec=' white',
![histogram like this: Thank you so much! 23]: def integer_distribution(arr_ints): plt.hist(faces, bins=unit_bins,](https://dsd5zvtm8ll6.cloudfront.net/si.experts.images/questions/2024/09/66f53635f11c8_22966f536357354f.jpg)
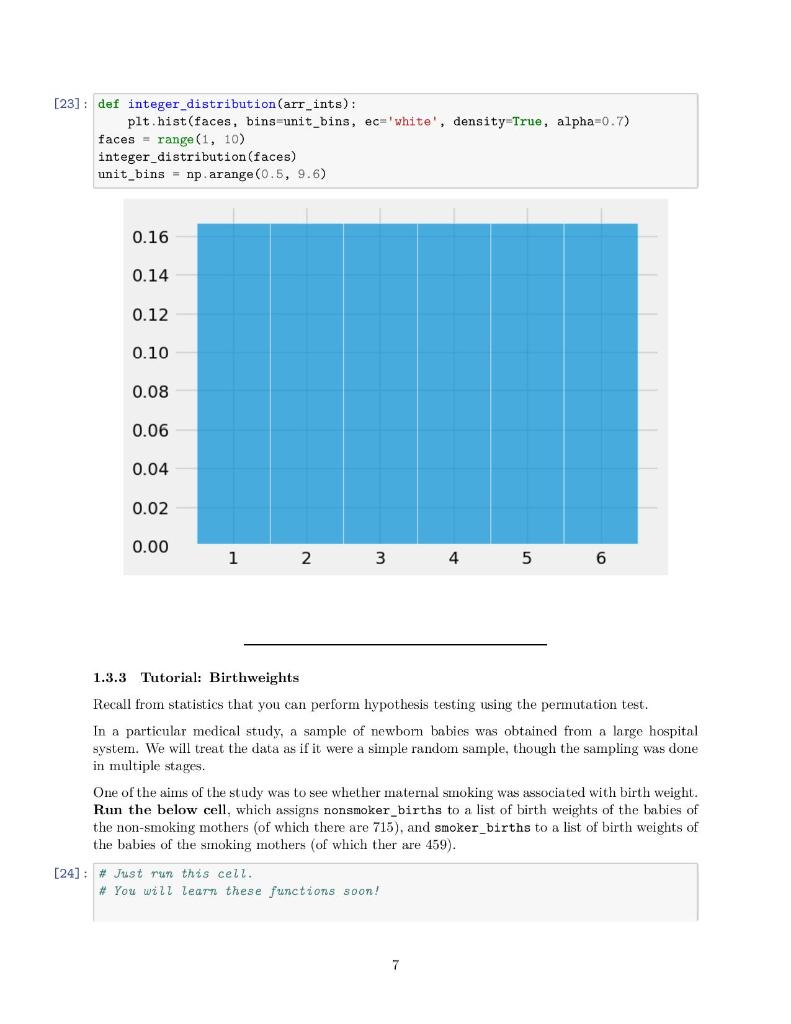
For Question 1e, what code shall I write to create a histogram like this:
 Thank you so much!
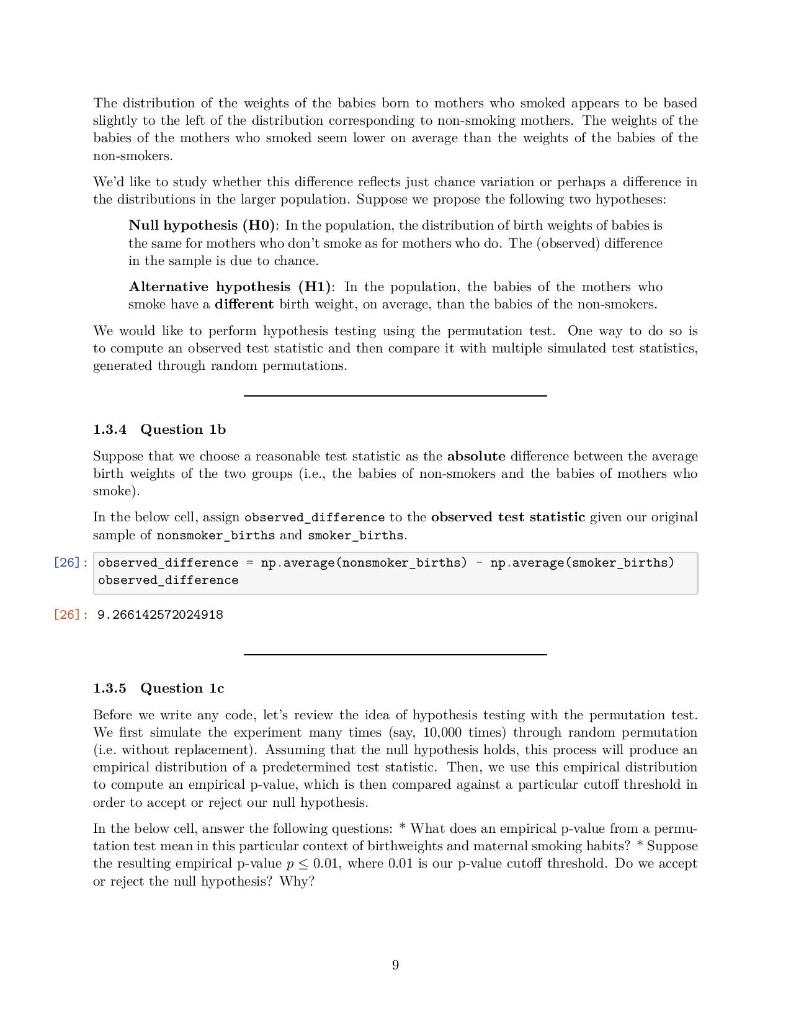
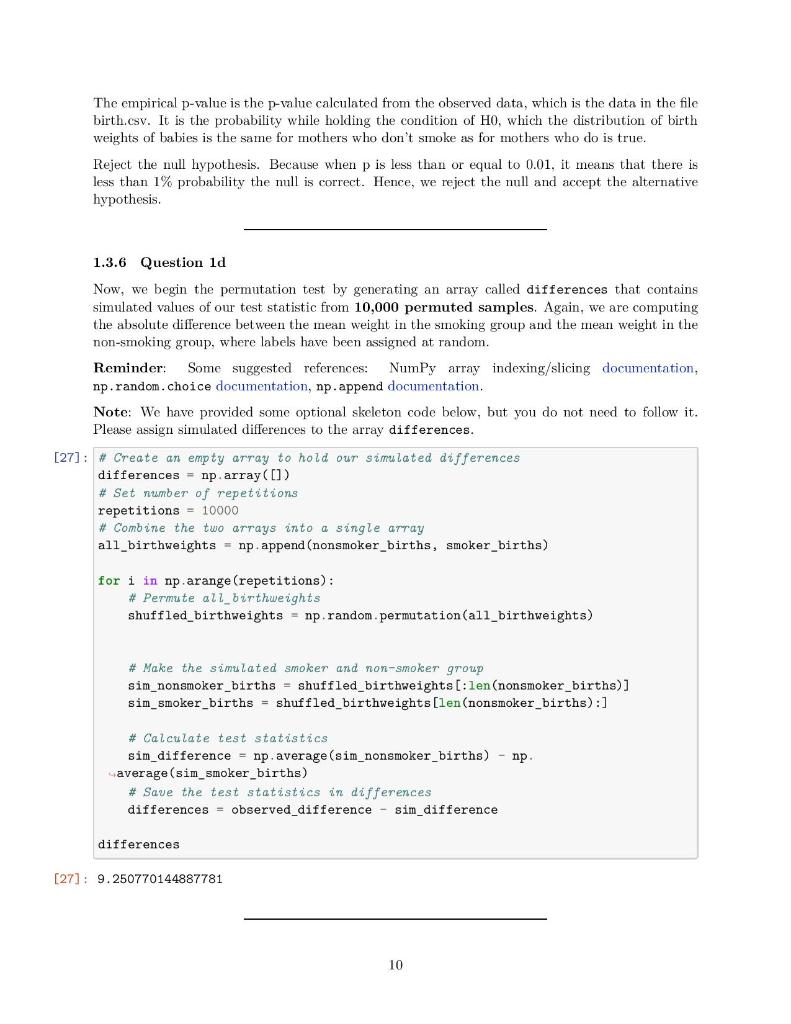
23]: def integer_distribution(arr_ints): plt.hist(faces, bins=unit_bins, ec=' white', density=True, alpha=0.7) faces = range (1,10) integer_distribution(faces) unit_bins = np.arange (0.5,9.6) 1.3.3 Tutorial: Birthweights Recall from statistics that you can perform hypothesis testing using the permutation test. In a particular medical study, a sample of newborn babies was obtained from a large hospital system. We will treat the data as if it were a simple random sample, though the sampling was done in multiple stages. One of the aims of the study was to see whether maternal smoking was associated with birth weight. R.un the below cell, which assigns nonsmoker_births to a list of birth weights of the babies of the non-smoking mothers (of which there are 715), and smoker_births to a list of birth weights of the babies of the smoking mothers (of which ther are 459 ). import_pandas as pd births_df = pd.read_csv("births.csv"') nonsmoker_births = births_df [ births_df['Maternal Smoker']]['Birth Weight']. ivalues print(len(nonsmoker_births)) smoker_births = births_df [births_df['Maternal_Smoker']]['Birth Weight'].values print(len(smoker_births)) 715 459 Suppose that we overlay the distributions of birthweights from the two groups of mothers: 25]: \# Just run this cell. \# You uill learn these functions soon! import seaborn as sns sns.histplot(births_df, x= "Birth Weight", hue="Maternal Smoker"); plt.title("Distribution of Birth Weight"); The distribution of the weights of the babies born to mothers who smoked appears to be based slightly to the left of the distribution corresponding to non-smoking mothers. The weights of the babies of the mothers who smoked seem lower on average than the weights of the babies of the non-smokers. We'd like to study whether this difference reflects just chance variation or perhaps a difference in the distributions in the larger population. Suppose we propose the following two hypotheses: Null hypothesis ( H0 ): In the population, the distribution of birth weights of babies is the same for mothers who don't smoke as for mothers who do. The (observed) difference in the sample is due to chance. Alternative hypothesis (H1): In the population, the babies of the mothers who smoke have a different birth weight, on average, than the babies of the non-smokers. We would like to perform hypothesis testing using the permutation test. One way to do so is to compute an observed test statistic and then compare it with multiple simulated test statistics, generated through random permutations. 1.3.4 Question 1b Suppose that we choose a reasonable test statistic as the absolute difference between the average birth weights of the two groups (i.e., the babies of non-smokers and the babies of mothers who smoke). In the below cell, assign observed_difference to the observed test statistic given our original sample of nonsmoker_births and smoker_births. 6] : observed_difference =np. average (nonsmoker_births) np.average(smoker_births) observed_difference 6]:9.266142572024918 1.3.5 Question 1c Before we write any code, let's review the idea of hypothesis testing with the permutation test. We first simulate the experiment many times (say, 10,000 times) through random permutation (i.e. without replacement). Assuming that the null hypothesis holds, this process will produce an empirical distribution of a predetermined test statistic. Then, we use this empirical distribution to compute an empirical p-value, which is then compared against a particular cutoff threshold in order to accept or reject our mull hypothesis. In the below cell, answer the following questions: * What does an empirical p-value from a permutation test mean in this particular context of birthweights and maternal smoking habits? * Suppose the resulting empirical p-value p0.01, where 0.01 is our p-value cutoff threshold. Do we accept or reject the null hypothesis? Why? The empirical p-value is the p-value calculated from the observed data, which is the data in the file birth.csv. It is the probability while holding the condition of H0, which the distribution of birth weights of babies is the same for mothers who don't smoke as for mothers who do is true. Reject the null hypothesis. Because when p is less than or equal to 0.01, it means that there is less than 1% probability the null is correct. Hence, we reject the null and accept the alternative hypothesis. 1.3.6 Question 1d Now, we begin the permutation test by generating an array called differences that contains simulated values of our test statistic from 10,000 permuted samples. Again, we are computing the absolute difference between the mean weight in the smoking group and the mean weight in the non-smoking group, where labels have been assigned at random. Reminder: Some suggested references: NumPy array indexing/slicing documentation, np. random. choice documentation, np.append documentation. Note: We have provided some optional skeleton code below, but you do not need to follow it. Please assign simulated differences to the array differences. [27]: \# Create an empty array to hold our simulated differences differences = np array([]) \# Set number of repetitions repetitions =10000 * Combine the two arrays into a single array all_birthweights =np. append (nonsmoker_births, smoker_births) for i in np.arange (repetitions): \# Permute ali_birthweights shuffled_birthweights =np.random.permutation(all_birthweights) \# Make the simulated smoker and non-smoker group sim_nonsmoker_births = shuffled_birthweights [:len (nonsmoker_births) ] sim_smoker_births = shuffled_birthweights [len (nonsmoker_births):] \# Calculate test statistics sim_difference =np. average (sim_nonsmoker_births )np. average (sim_smoker_births) \# Save the test statistics in differences differences = observed_difference - sim_difference differences 1.3.7 Question 1e The array differences is an empirical distribution of the test statistic simulated under the null hypothesis. This is a prediction about the test statistic, based on the null hypothesis. Use the integer_distribution function you defined in an earlier part to plot a histogram of this empirical distribution. Because you are using this function, your histogram should have unit bins, with bars centered at integers. No title or labels are required for this question. Hint: This part should be very straightforward. integer_distribution (differences) 1.3.8 Question 1f Compute empirical_p, the empirical p-value based on differences, the empirical distribution of the test statistic, and observed_difference, the observed value of the test statistic. 19] : empirical_p = np.count_nonzero(differences
Step by Step Solution
There are 3 Steps involved in it

Get step-by-step solutions from verified subject matter experts