Question: for question 2 show all work and calculations. Including a graph of the 2 products and explain what the graph means. CASE M&L MANUFACTURING Week
for question 2 show all work and calculations. Including a graph of the 2 products and explain what the graph means.
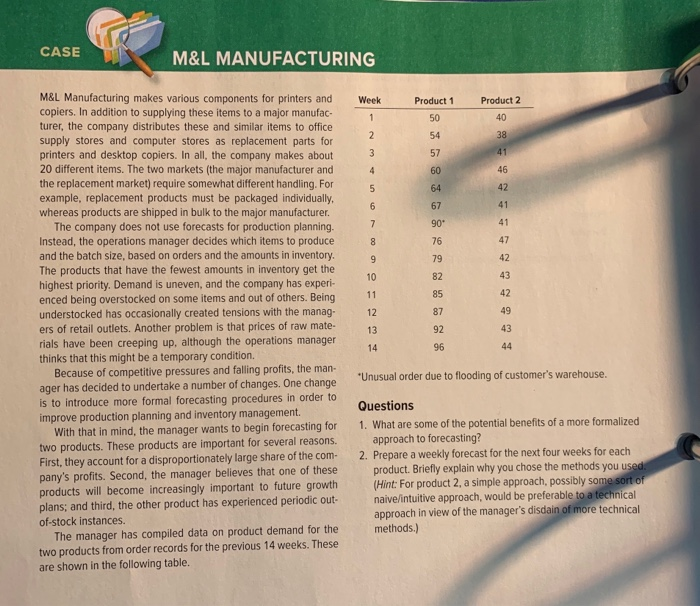
CASE M&L MANUFACTURING Week Product 1 50 54 Product 2 40 1 2 38 3 57 41 4 60 46 5 64 42 6 67 41 7 90 41 8 47 76 79 9 42 10 82 43 11 85 42 12 87 49 M&L Manufacturing makes various components for printers and copiers. In addition to supplying these items to a major manufac- turer, the company distributes these and similar items to office supply stores and computer stores as replacement parts for printers and desktop copiers. In all the company makes about 20 different items. The two markets (the major manufacturer and the replacement market) require somewhat different handling. For example, replacement products must be packaged individually, whereas products are shipped in bulk to the major manufacturer. The company does not use forecasts for production planning. Instead, the operations manager decides which items to produce and the batch size, based on orders and the amounts in inventory. The products that have the fewest amounts in inventory get the highest priority. Demand is uneven, and the company has experi- enced being overstocked on some items and out of others. Being understocked has occasionally created tensions with the manag. ers of retail outlets. Another problem is that prices of raw mate- rials have been creeping up, although the operations manager thinks that this might be a temporary condition. Because of competitive pressures and falling profits, the man- ager has decided to undertake a number of changes. One change is to introduce more formal forecasting procedures in order to improve production planning and inventory management. With that in mind, the manager wants to begin forecasting for two products. These products are important for several reasons. First, they account for a disproportionately large share of the com- pany's profits. Second, the manager believes that one of these products will become increasingly important to future growth plans, and third, the other product has experienced periodic out- of-stock instances The manager has compiled data on product demand for the two products from order records for the previous 14 weeks. These are shown in the following table. 13 92 43 14 96 44 "Unusual order due to flooding of customer's warehouse. Questions 1. What are some of the potential benefits of a more formalized approach to forecasting? 2. Prepare a weekly forecast for the next four weeks for each product. Briefly explain why you chose the methods you used. (Hint: For product 2, a simple approach, possibly some sort of naive/intuitive approach, would be preferable to a technical approach in view of the manager's disdain of more technical methods.) o Make sure to plot the data (for both products) and interpret the graphs. o Include graphs in your report. Answer both questions given in the case. o Need to justify your selection of the forecasting method(s) and show all your calculations in detail. o For product 2, use combination of less technical/intuitive methods, such as Nave, MA, etc., and your insights. Do not constraint yourself to a specific method to forecast all 4 quarters; you can use combination of methods. CASE M&L MANUFACTURING Week Product 1 50 54 Product 2 40 1 2 38 3 57 41 4 60 46 5 64 42 6 67 41 7 90 41 8 47 76 79 9 42 10 82 43 11 85 42 12 87 49 M&L Manufacturing makes various components for printers and copiers. In addition to supplying these items to a major manufac- turer, the company distributes these and similar items to office supply stores and computer stores as replacement parts for printers and desktop copiers. In all the company makes about 20 different items. The two markets (the major manufacturer and the replacement market) require somewhat different handling. For example, replacement products must be packaged individually, whereas products are shipped in bulk to the major manufacturer. The company does not use forecasts for production planning. Instead, the operations manager decides which items to produce and the batch size, based on orders and the amounts in inventory. The products that have the fewest amounts in inventory get the highest priority. Demand is uneven, and the company has experi- enced being overstocked on some items and out of others. Being understocked has occasionally created tensions with the manag. ers of retail outlets. Another problem is that prices of raw mate- rials have been creeping up, although the operations manager thinks that this might be a temporary condition. Because of competitive pressures and falling profits, the man- ager has decided to undertake a number of changes. One change is to introduce more formal forecasting procedures in order to improve production planning and inventory management. With that in mind, the manager wants to begin forecasting for two products. These products are important for several reasons. First, they account for a disproportionately large share of the com- pany's profits. Second, the manager believes that one of these products will become increasingly important to future growth plans, and third, the other product has experienced periodic out- of-stock instances The manager has compiled data on product demand for the two products from order records for the previous 14 weeks. These are shown in the following table. 13 92 43 14 96 44 "Unusual order due to flooding of customer's warehouse. Questions 1. What are some of the potential benefits of a more formalized approach to forecasting? 2. Prepare a weekly forecast for the next four weeks for each product. Briefly explain why you chose the methods you used. (Hint: For product 2, a simple approach, possibly some sort of naive/intuitive approach, would be preferable to a technical approach in view of the manager's disdain of more technical methods.)