

Question: FOR QUESTION 2 , THE BAR CHART TO SHOW DISTRIBUTION OF GENDER IN THE PREPARATION OF COURSE PART, WHY DOES THE OUTPUT LIKE THAT ABOVE
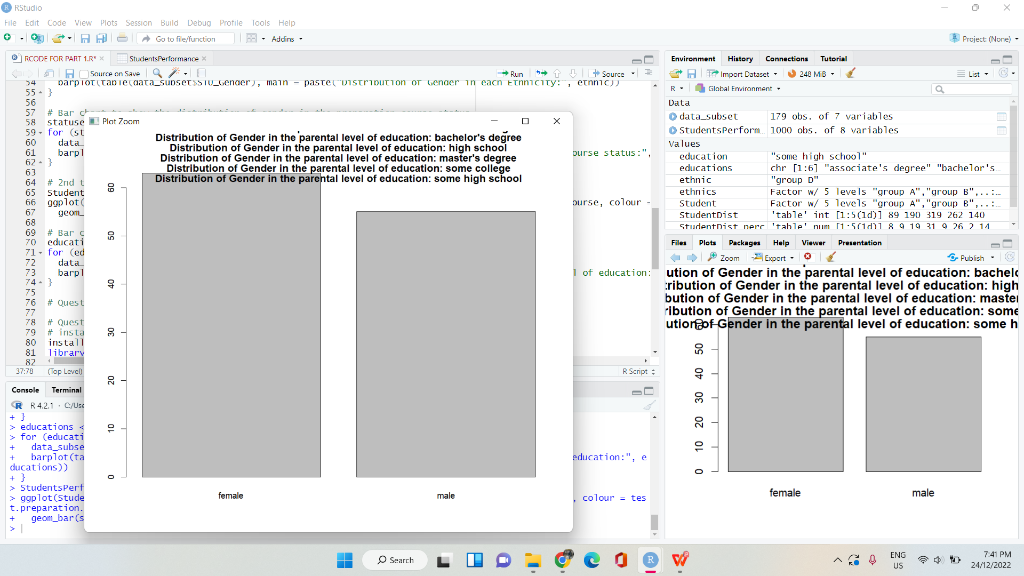
FOR QUESTION 2, THE BAR CHART TO SHOW DISTRIBUTION OF GENDER IN THE PREPARATION OF COURSE PART, WHY DOES THE OUTPUT LIKE THAT ABOVE THE CHART? PLEASE FIX THE CODE :
# Bar chart to show the distribution of gender in the preparation course status statuses
USING R PROGRAMMING! PLEASE TAKE NOTE THIS IS FOR QUESTION 2!
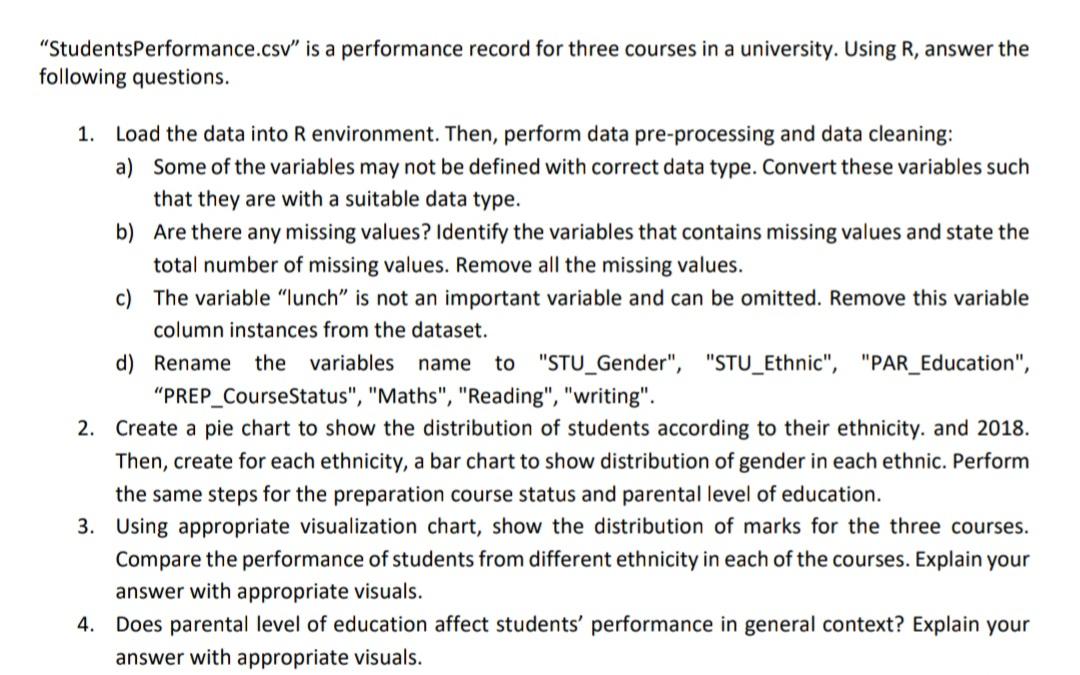
of education: ution of Gender in the parental level of education: bachelc ribution of Gender in the parental level of education: high bution of Gender in the parental level of education: mastel ribution of Gender in the parental level of education: some utiongof-Gender in the parental level of education: some h "StudentsPerformance.csv" is a performance record for three courses in a university. Using R, answer the ollowing questions. 1. Load the data into R environment. Then, perform data pre-processing and data cleaning: a) Some of the variables may not be defined with correct data type. Convert these variables such that they are with a suitable data type. b) Are there any missing values? Identify the variables that contains missing values and state the total number of missing values. Remove all the missing values. c) The variable "lunch" is not an important variable and can be omitted. Remove this variable column instances from the dataset. d) Rename the variables name to "STU_Gender", "STU_Ethnic", "PAR_Education", "PREP_CourseStatus", "Maths", "Reading", "writing". 2. Create a pie chart to show the distribution of students according to their ethnicity. and 2018. Then, create for each ethnicity, a bar chart to show distribution of gender in each ethnic. Perform the same steps for the preparation course status and parental level of education. 3. Using appropriate visualization chart, show the distribution of marks for the three courses. Compare the performance of students from different ethnicity in each of the courses. Explain your answer with appropriate visuals. 4. Does parental level of education affect students' performance in general context? Explain your answer with appropriate visuals
Step by Step Solution
There are 3 Steps involved in it

Get step-by-step solutions from verified subject matter experts