

Question: For Questions 3 - 5, use the data on the MLB tab. This is a random sample of 120 pitchers that had their MLB debut
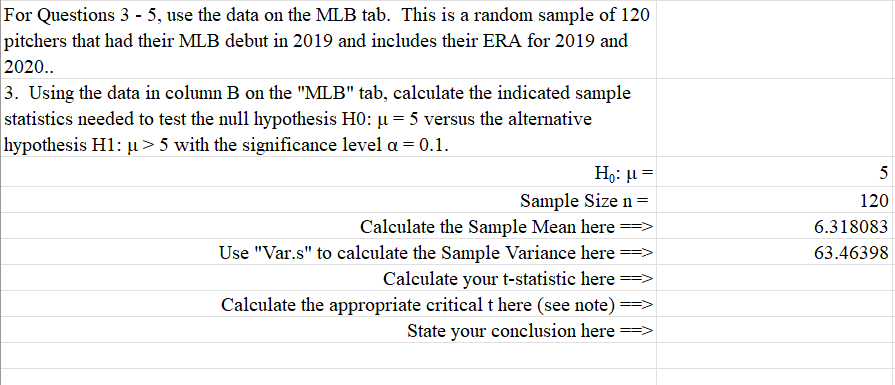
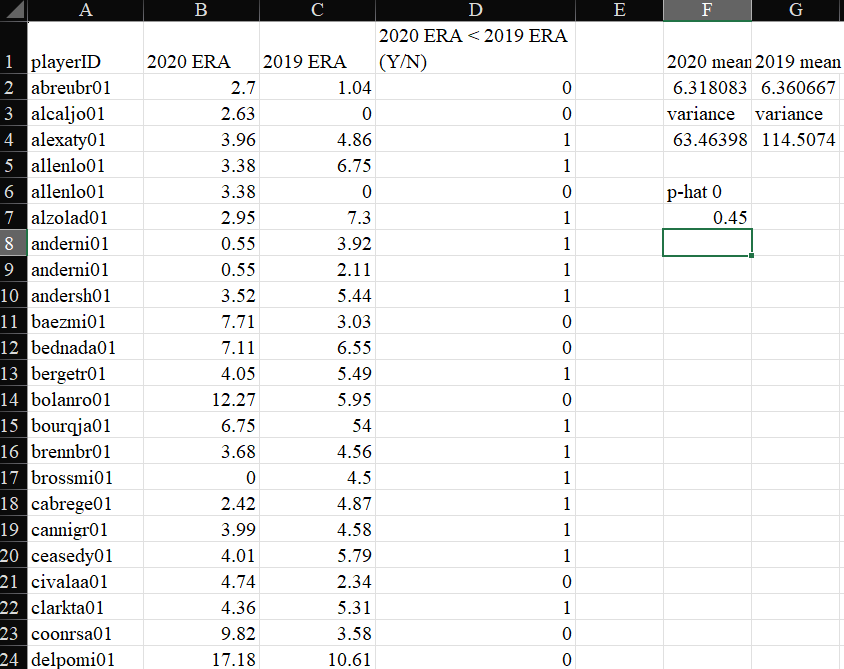
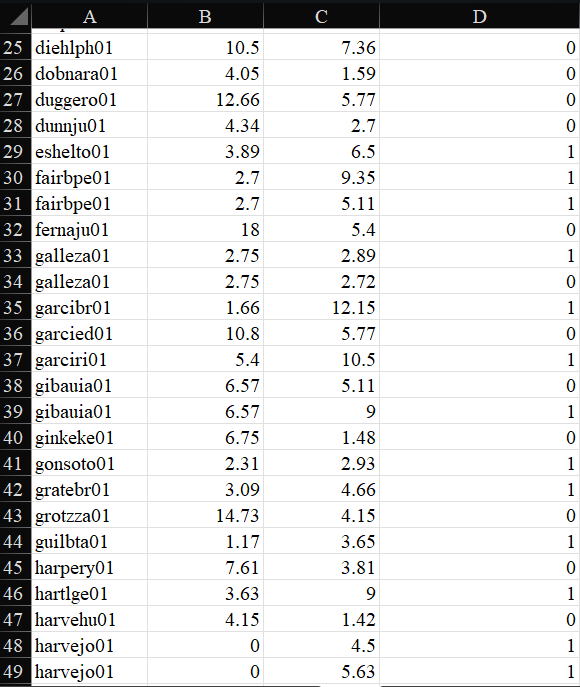
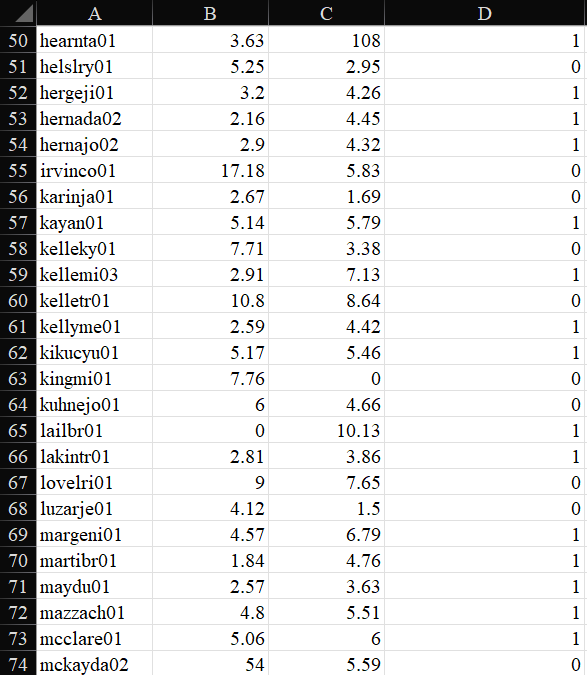
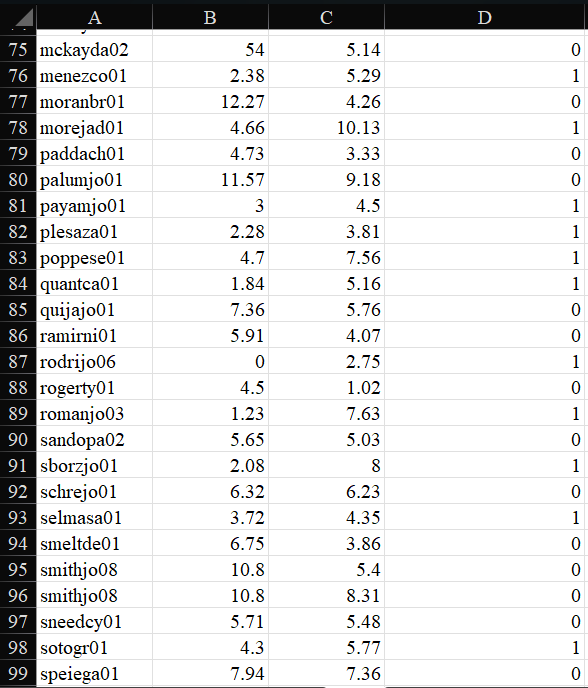
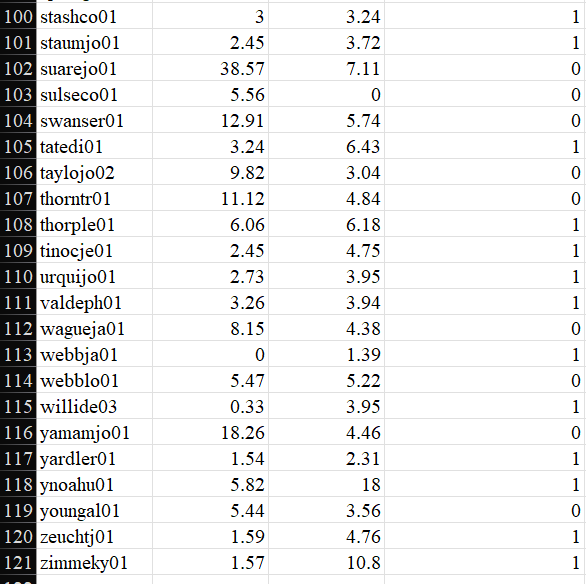
For Questions 3 - 5, use the data on the MLB tab. This is a random sample of 120 pitchers that had their MLB debut in 2019 and includes their ERA for 2019 and 2020.. 3. Using the data in column B on the "MLB" tab, calculate the indicated sample statistics needed to test the null hypothesis HO: p = 5 versus the alternative hypothesis H1: p = 5 with the significance level a =0.1. Hy: p= Sample Sizen= Calculate the Sample Mean here == Use "Var.s" to calculate the Sample Variance here == Calculate your t-statistic here === Calculate the appropriate critical t here (see note) == State your conclusion here === 5 120 6.318083 63.46398 \f\f\f\f\f
Step by Step Solution
There are 3 Steps involved in it

Get step-by-step solutions from verified subject matter experts