

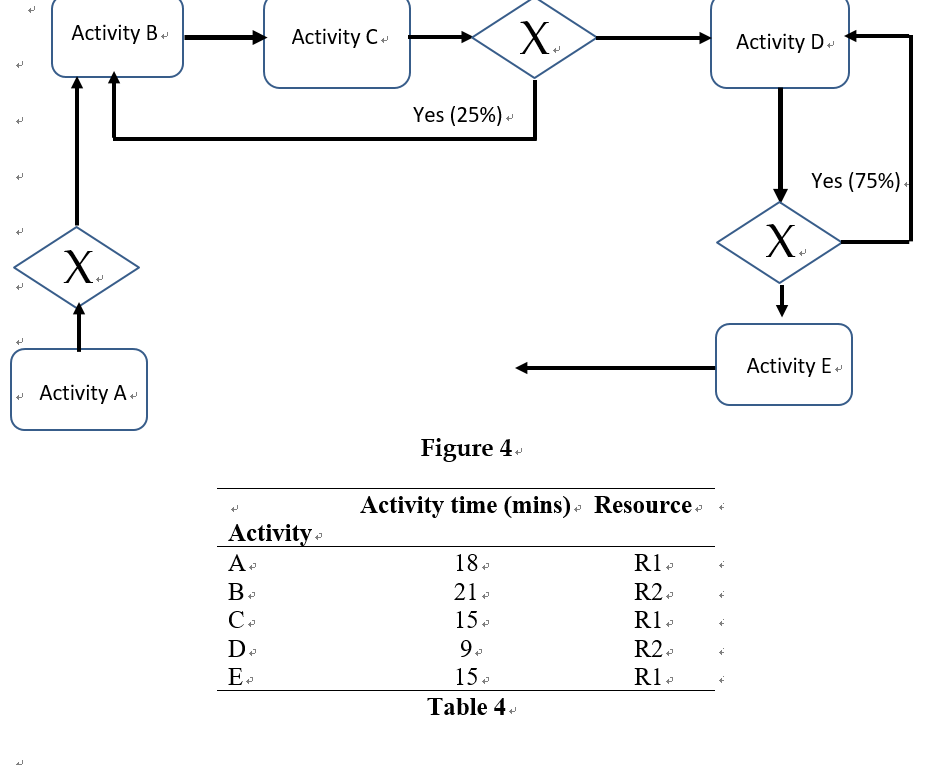
Question: For the business process flow chart given in Figure 4, where the activity times are given in Table 4, calculate the cycle time efficiency. Table
For the business process flow chart given in Figure 4, where the activity times are given in Table 4, calculate the cycle time efficiency. Table 4 shows the activity time and the resource type needed by each activity as well. For the first loop shown in Figure 4, assume that after re-work the probability of an error remains the same and re-work may be done any number of times. For the second loop shown in Figure 4, assume that re-work is allowed only once. There is 10 unit of resource R1 and 20 units of resource R2.
(a)Calculate the average cycle time for this process [2 marks]
(b)Calculate the pool capacity of each resource and identify the bottleneck.
[5 marks]
(c) If the actual throughput is 10 job per hour, what is the business process capacity utilisation? [2 marks]
Step by Step Solution
There are 3 Steps involved in it

Get step-by-step solutions from verified subject matter experts