

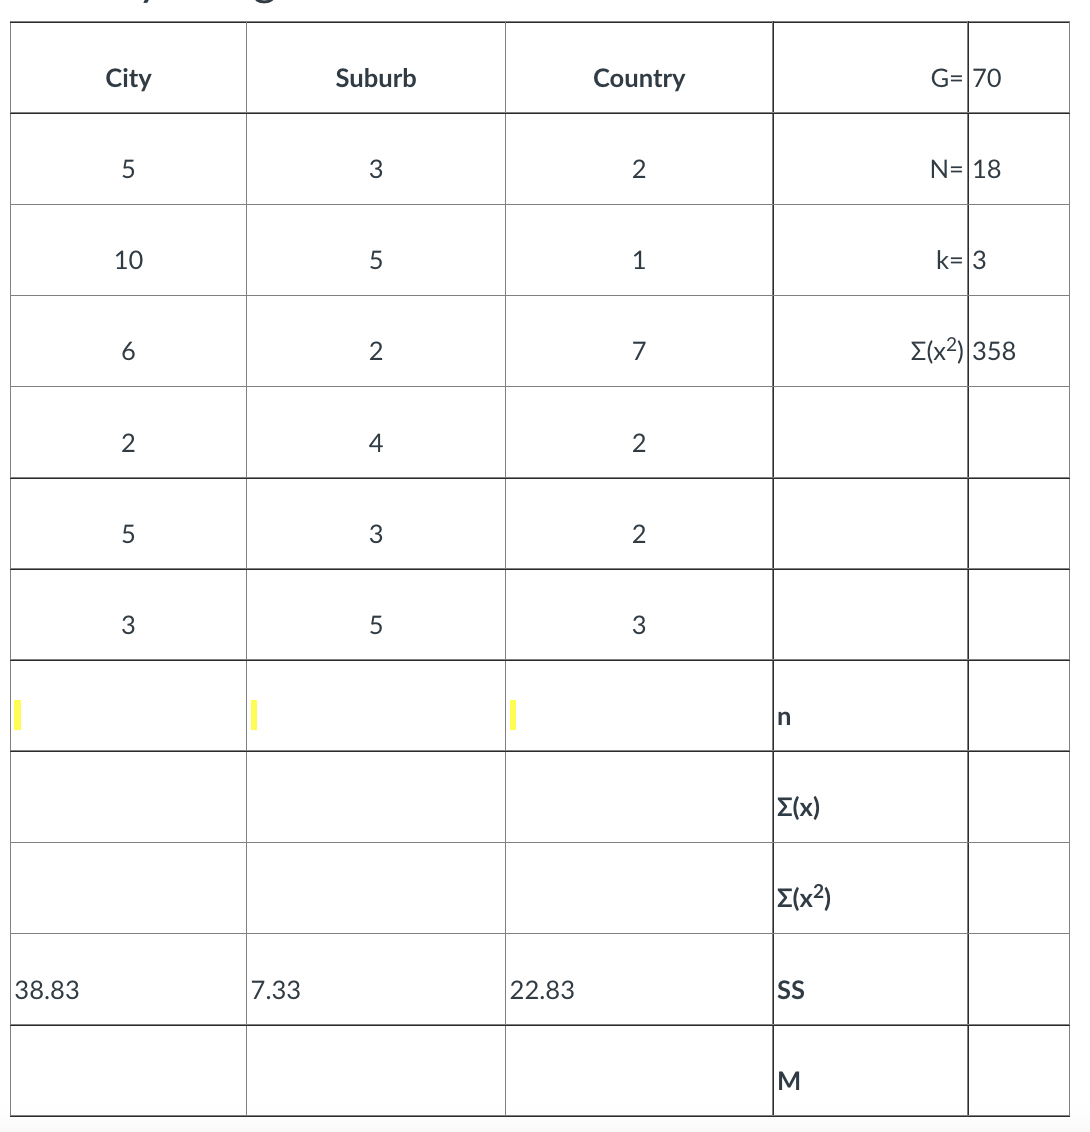
Question: For the data chart, calculate the f-ratio City 70 18 10 38.83 Suburb 7.33 Country 22.83 E(x2) 358 E(x2) ss
For the data chart, calculate the f-ratio

City 70 18 10 38.83 Suburb 7.33 Country 22.83 E(x2) 358 E(x2) ss
Step by Step Solution
There are 3 Steps involved in it
1 Expert Approved Answer
Step: 1 Unlock

Question Has Been Solved by an Expert!
Get step-by-step solutions from verified subject matter experts
Step: 2 Unlock
Step: 3 Unlock