

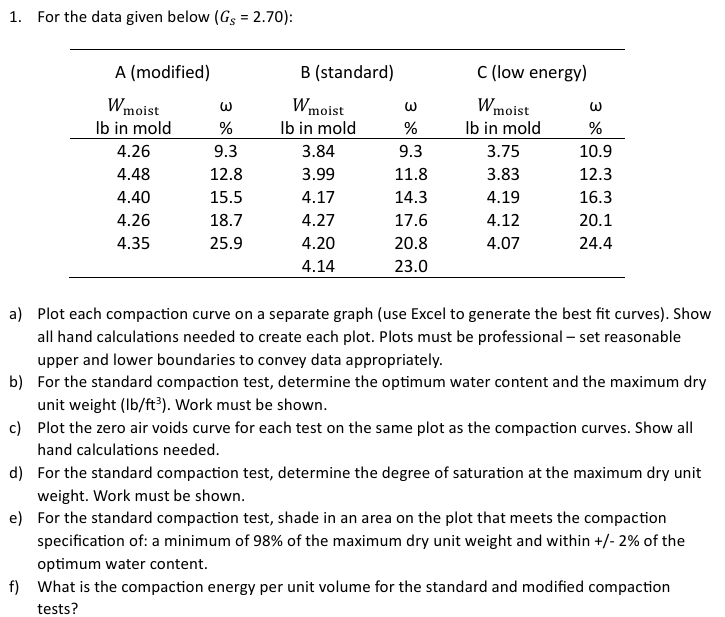
Question: For the data given below ( left ( G _ { S } = 2 . 7 0 right ) )
For the data given below leftGSright :
a Plot each compaction curve on a separate graph use Excel to generate the best fit curves Show all hand calculations needed to create each plot. Plots must be professional set reasonable upper and lower boundaries to convey data appropriately.
b For the standard compaction test, determine the optimum water content and the maximum dry unit weight leftmathrmlbmathrmftright Work must be shown.
c Plot the zero air voids curve for each test on the same plot as the compaction curves. Show all hand calculations needed.
d For the standard compaction test, determine the degree of saturation at the maximum dry unit weight. Work must be shown.
e For the standard compaction test, shade in an area on the plot that meets the compaction specification of: a minimum of of the maximum dry unit weight and within of the optimum water content.
f What is the compaction energy per unit volume for the standard and modified compaction tests?
Step by Step Solution
There are 3 Steps involved in it
1 Expert Approved Answer
Step: 1 Unlock

Question Has Been Solved by an Expert!
Get step-by-step solutions from verified subject matter experts
Step: 2 Unlock
Step: 3 Unlock