

Question: For the data given below plot and provide the requested answers. Make predictions ranges at a temperature of 190 of both an individual value
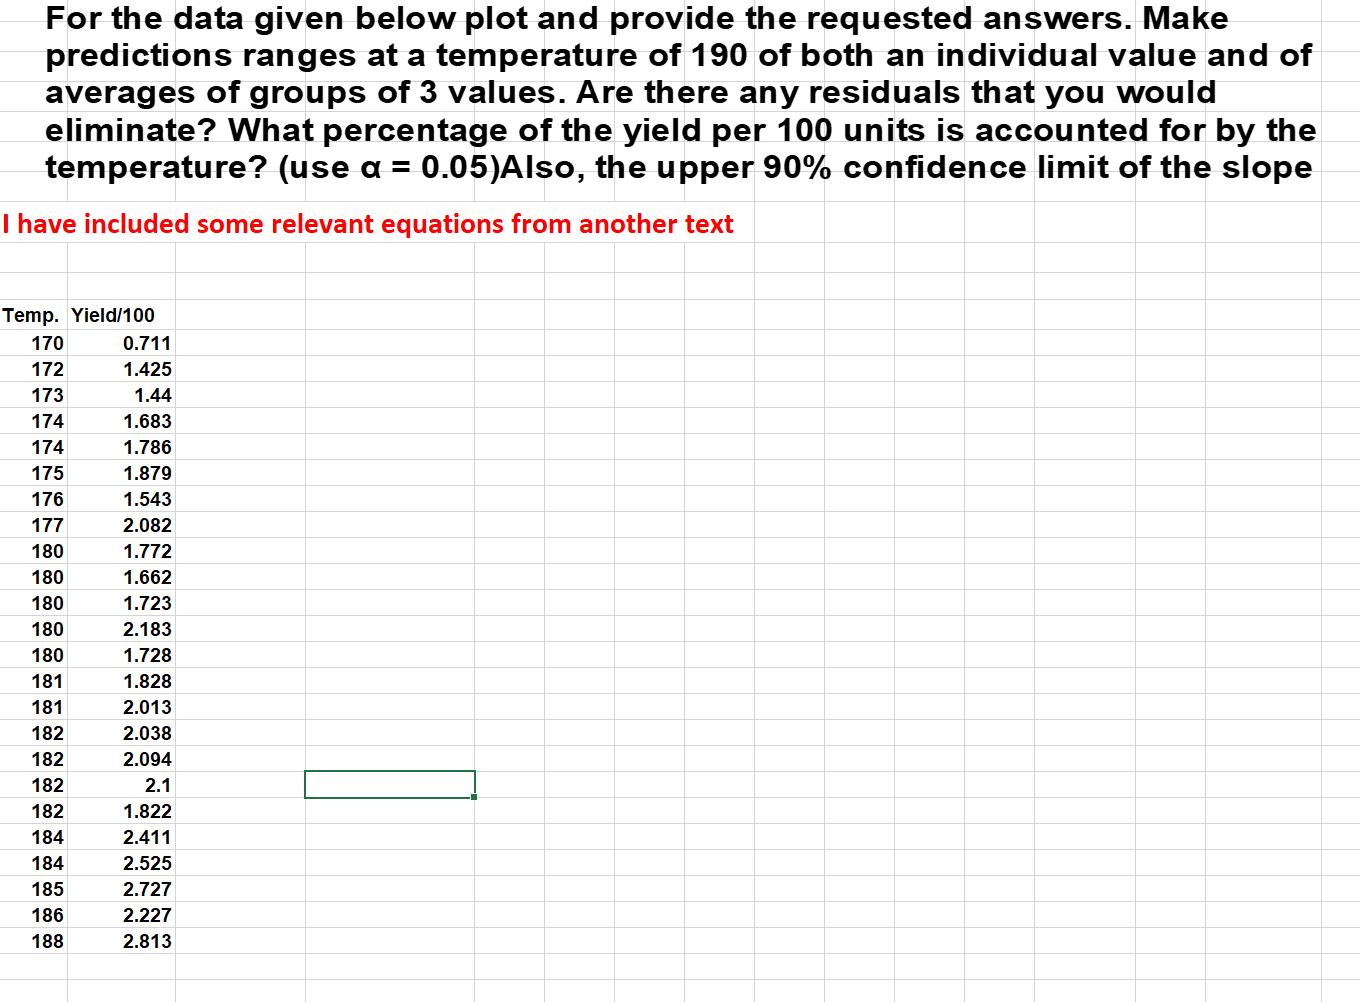
For the data given below plot and provide the requested answers. Make predictions ranges at a temperature of 190 of both an individual value and of averages of groups of 3 values. Are there any residuals that you would eliminate? What percentage of the yield per 100 units is accounted for by the temperature? (use a = 0.05)Also, the upper 90% confidence limit of the slope I have included some relevant equations from another text Temp. Yield/100 170 172 173 174 174 175 176 177 180 180 180 180 180 181 181 182 182 182 182 184 184 185 186 188 0.711 1.425 1.44 1.683 1.786 1.879 1.543 2.082 1.772 1.662 1.723 2.183 1.728 1.828 2.013 2.038 2.094 2.1 1.822 2.411 2.525 2.727 2.227 2.813
Step by Step Solution
3.33 Rating (162 Votes )
There are 3 Steps involved in it
Yield10012706652 00815169 Temp ANOVA table Scurte OF Sum of Square Mean Square F Statistic Pvalue ... View full answer

Get step-by-step solutions from verified subject matter experts