

Question: For the data on 26 red wines given above, conduct the following analysis: i. Provide five-number summary i.e. the minimum, 1st quartile, median, 3rd quartile
For the data on 26 red wines given above, conduct the following analysis:
i. Provide five-number summary i.e. the minimum, 1st quartile, median, 3rd quartile and
maximum value for fixed acidity. Arrange them in increasing order on a straight line, draw a box plot and interpret what it means.
ii. Calculate the correlation coefficient between fixed acidity and volatile acidity and
between residual sugar and chlorides. Comment on the strength and direction of
association for the two variable pairs.
iii. What can be stated about the cause-effect relationship between fixed acidity and
volatile acidity, based on the correlation coefficient score?
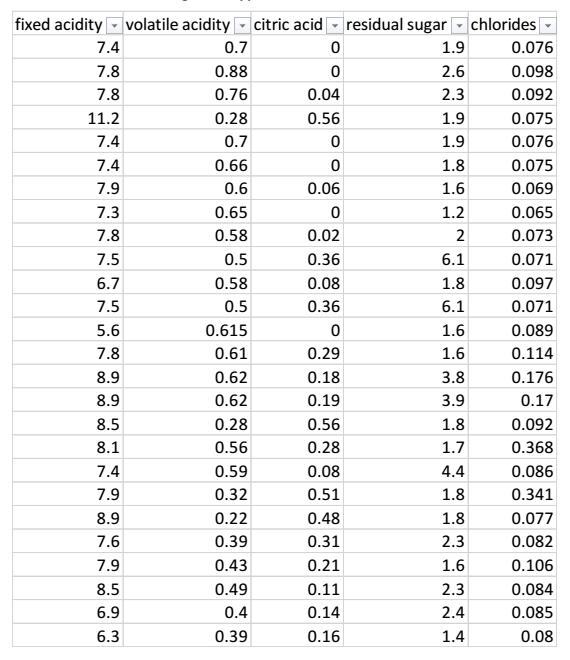
fixed acidity volatile acidity citric acid residual sugar - chlorides 7.4 0.7 1.9 0.076 7.8 0.88 2.6 0.098 7.8 0.76 0.04 2.3 0.092 11.2 0.28 0.56 1.9 0.075 7.4 0.7 1.9 0.076 7.4 0.66 1.8 0.075 7.9 0.6 0.06 1.6 0.069 7.3 0.65 1.2 0.065 7.8 0.58 0.02 2 0.073 7.5 0.5 0.36 6.1 0.071 6.7 0.58 0.08 1.8 0.097 7.5 0.5 0.36 6.1 0.071 5.6 0.615 1.6 0.089 7.8 0.61 0.29 1.6 0.114 8.9 0.62 0.18 3.8 0.176 8.9 0.62 0.19 3.9 0.17 8.5 0.28 0.56 1.8 0.092 8.1 0.56 0.28 1.7 0.368 7.4 0.59 0.08 4.4 0.086 7.9 0.32 0.51 1.8 0.341 8.9 0.22 0.48 1.8 0.077 7.6 0.39 0.31 2.3 0.082 7.9 0.43 0.21 1.6 0.106 8.5 0.49 0.11 2.3 0.084 6.9 0.4 0.14 2.4 0.085 6.3 0.39 0.16 1.4 0.08
Step by Step Solution
3.33 Rating (168 Votes )
There are 3 Steps involved in it
To conduct the analysis for the given data follow the steps below i FiveNumber Summary and Box Plot ... View full answer

Get step-by-step solutions from verified subject matter experts