

Question: For the data screenshot sent , I need Code in R for the following questions ## PART A: ### A 1 : Get tourism data
For the data screenshot sent I need Code in R for the following questions
## PART A:
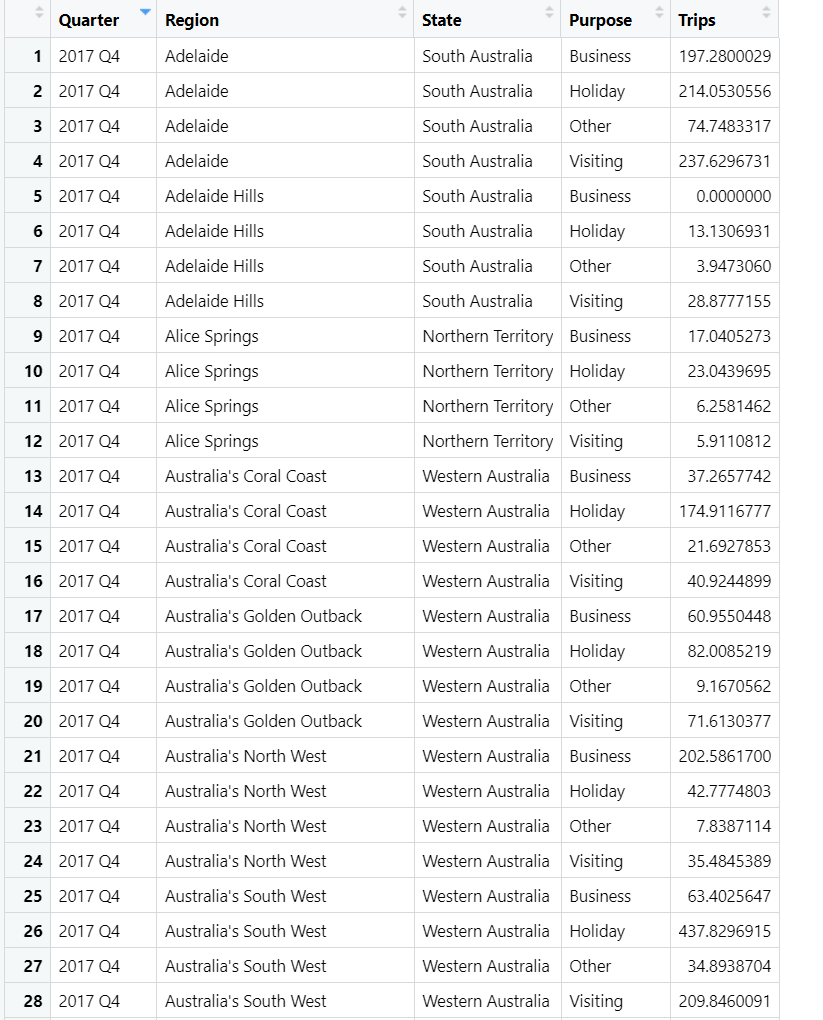
### A: Get tourism data as given below from the link. Then convert the data into tsibble format by using tsibble functions. Save it as mytourism
### A To analyze the data, first view mytourism set, and see the dates of the data.
#### Is it annual or quarterly data? Which year does it start from?
#### Use tableStatePurpose command to see the crosstable. How many States are there in the data? How many Purpose of trips category?
#### Group the data by Region and Purpose by using group command.To eliminate time effect, use tibble format. ie astibble groupbyRegion Purpose
#### After grouping the data in # use summarize function to get the average of Trips for each combination, and assign it as Trips ie summariseTrips meanTrips
#### Find which region has Purpose had the maximum number of overnight trips on average. ungroup the data to find the result ie ungroup filterTrips maxTrips
### AQuestion: Create a new tsibble which combines the Purposes and Regions,and just has total trips by State. ie groupbyStatesummariseTrips sumTrips Then ungroup the data. Save it as statetourism.
## PART B:
### BQuestion: Create plots of the following time series. Analyze it visually. What do you see? comment on the below in Answer.
## PART C:
### C Question: Use mytourism data you created as tsibble in A Filter Region for SnowyMountains and save it as snowy.
### C Question: Use autoplot ggseason and ggsubseries to explore the snowy data. What do you observe? What type of pattern do you see. Write your comment on Answer below
## PART D:
### DQuestion: Use these two functions gglag ACF to explore the following time series: iBricks from ausproduction iiLynx from pelt iii Victorian Electricity Demand from auselec. Write your comments about each graphs you created
### DQuestion: after using these functions, Can you spot any seasonality, cyclicity and trend? What do you learn about the series? Write your comments below for each series:
#### i Bricks
#### ii Lynx from pelt:
#### iii Electricity
## PART E: See the data below for Google Stock price from the gafastock data set.
### E: Calculate the first difference of the "goog" series.
### E Question: Does "diff" difference of the series look like white noise? Recall the definition of white noise. Recall what function do you use to check if a series is white noise or not. Use the necessary graph that shows if a series is white noise? Comment based on the graph.
Step by Step Solution
There are 3 Steps involved in it
1 Expert Approved Answer
Step: 1 Unlock

Question Has Been Solved by an Expert!
Get step-by-step solutions from verified subject matter experts
Step: 2 Unlock
Step: 3 Unlock